
In last week’s post, I summarized the results of our study “How Long Will You Stay Single” and explained how we came up with these results. This week, we’ll go into the details on how different aspects of our demographic identity affect how long you stay single.
It’s worth repeating is that these results are based on Nanaya user data. At Nanaya, we don’t determine what it means to be single or in a relationship – our users do. So the best way of understand what “single” means here is the time between when people say they’re in a relationship. We also call this the “rebound” time.
These are also pretty general results! You can get personalized results by trying Nanaya for free today!
Gender & Orientation
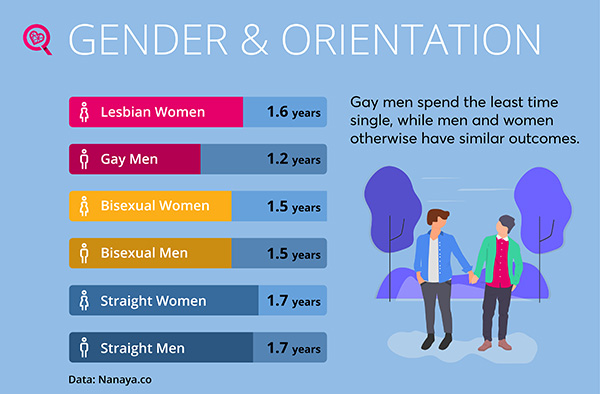
When it comes to straight people, who represent about 90% of the population, there is very little difference between men and women. Period.
Outcomes for people who are bisexual are similar to those of straight people. There appears to be slightly lower probability of staying single after three years compared to straight people, but more data is required to show that this is statistically significant.
Unlike straight and bisexual dating, gay dating shows a clear difference between men and women. Gay men universally have the shortest rebound times, distinguishing themselves from all other combinations of gender and orientation. As we’ll cover in future studies, gay men have the most active romantic lives and it is further evidenced in this study.
Table 1. Gender & Orientation Data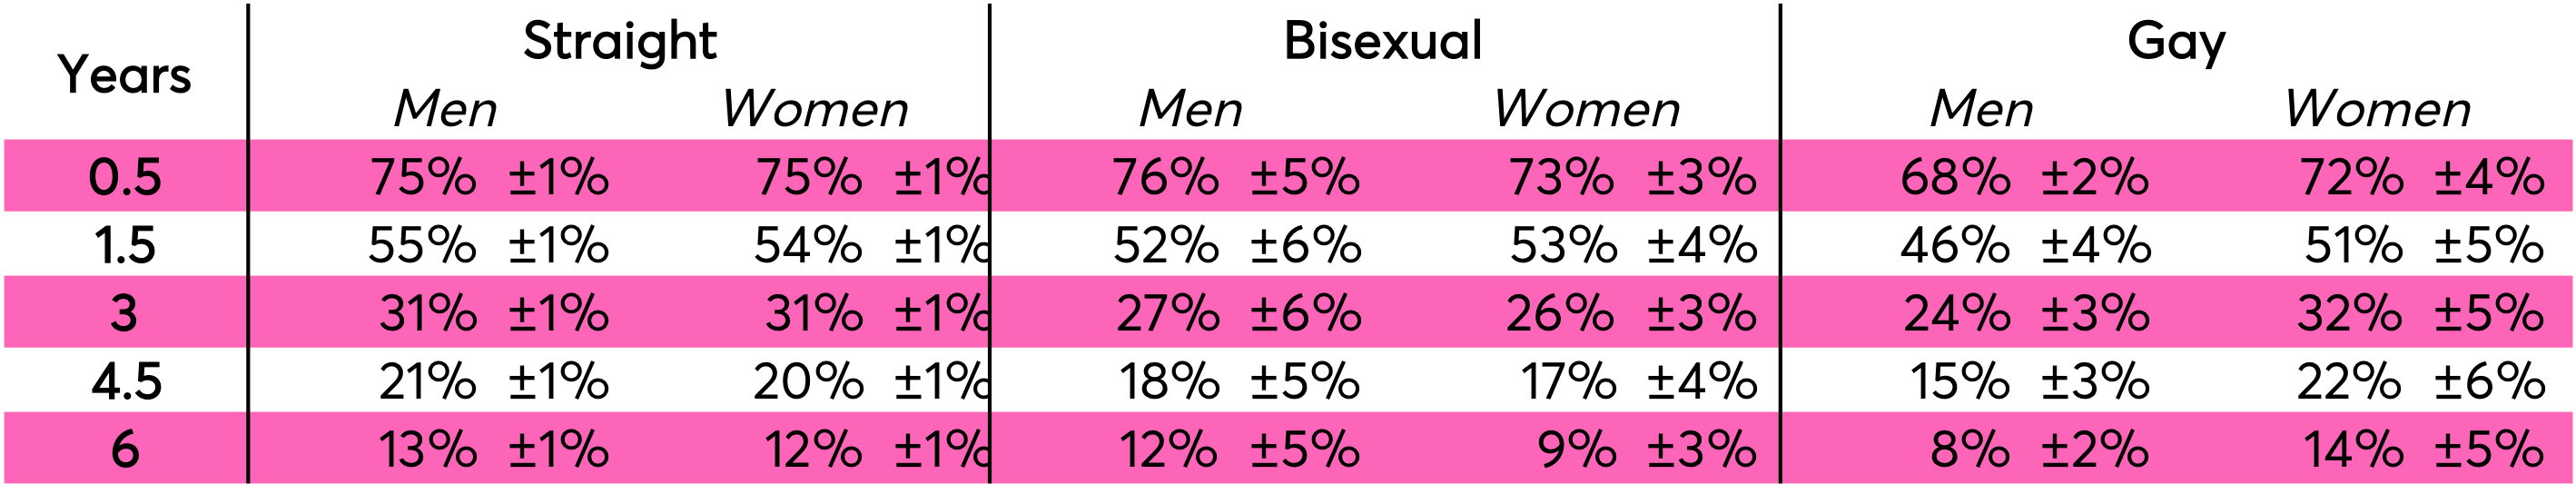
Age
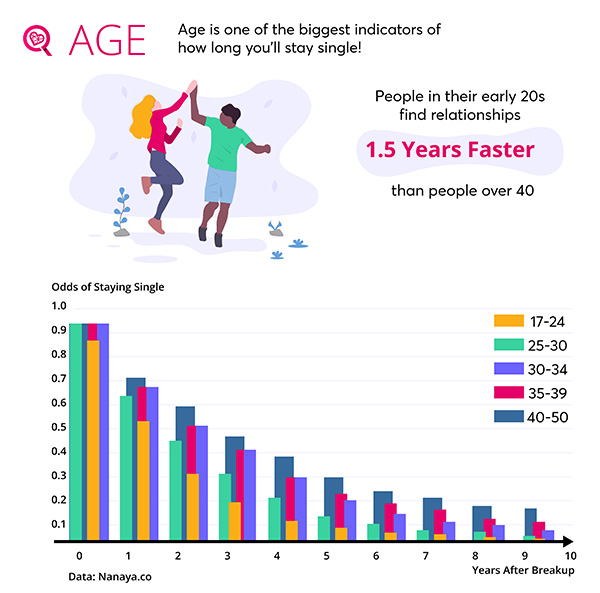
Compared to any other aspect of identity or anything else we evaluated in this study, age is the number one determiner of how long you’ll stay single. Simply put, people who are younger are far more likely to reenter a relationship than those who are older. Between those in the youngest group, 17-24 years old, and the oldest, 40-50 years old, the difference between the average time spent single is 1.5 years!
Table 2. Age data.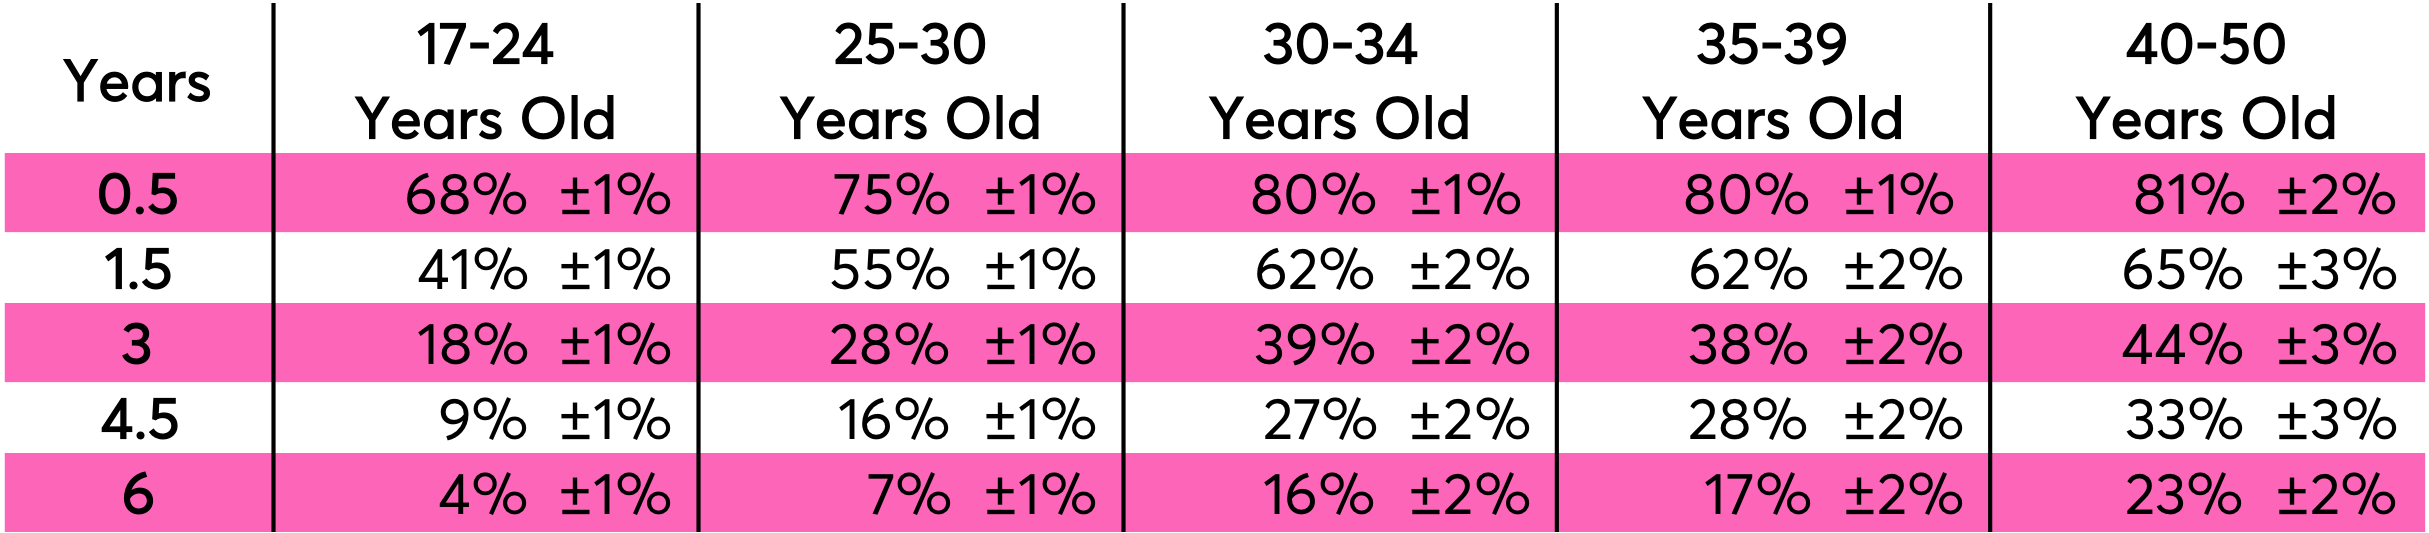
Interestingly, there is little distinction between those aged 30-34 and 35-39. Based on other Nanaya research, this indicates that social behavior changes slowly during one’s 30s.
Another fascinating implication is in the last row, where individuals remain single for at least six years after a breakup. This number grows more and more the older you get. Indeed, if 23% of a population is remaining single after 40-50 years old, it’s quite likely you’ll never end up in a committed relationship.
There’s a lot of reasons we can come up with here, but the impact of aging on romance is something we’ll study further in other Nanaya studies. So stay tuned!
Being American
If America is #1, it might be #1 in staying single.
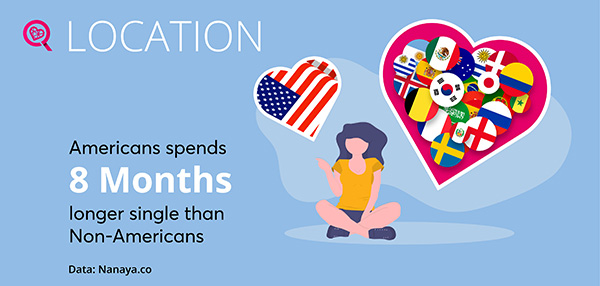
Nanaya serves users around the world and we have collected a lot of data to determine the impact of dating in different places. Here, we evaluate the impact of simply being American.
Simply put, Americans have it much harder than their non-American counterparts in finding someone. Non-Americans show a 10% better chance of finding a relationship than Americans at nearly all points after a breakup.
Table 3. American and Non-American data.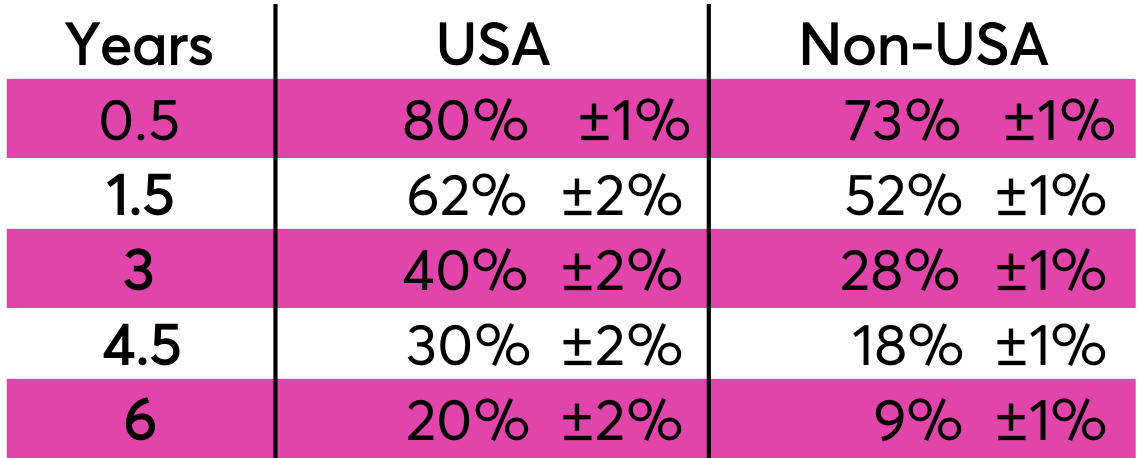
It bears mentioning that most of non-US dataset reflects Brazilians, other Latin Americans, and Western Europeans. We look forward to expanding our results on a national level as data becomes available. Separately, we have plenty of American users, so it’s interesting to see the variation in the results for Americans as evidenced by the confidence intervals.
Level of Education
Personally, the relationship between level of education and rebound time is one of the most unexpected and fascinating results of this study. The relationship is unmistakable, consistent, and significant – the more you study through the course of your life, the longer you’ll stay single. To confirm this, we only evaluated users over 25 years old to make sure that age did not significantly impact this analysis.
Table 4. Education data.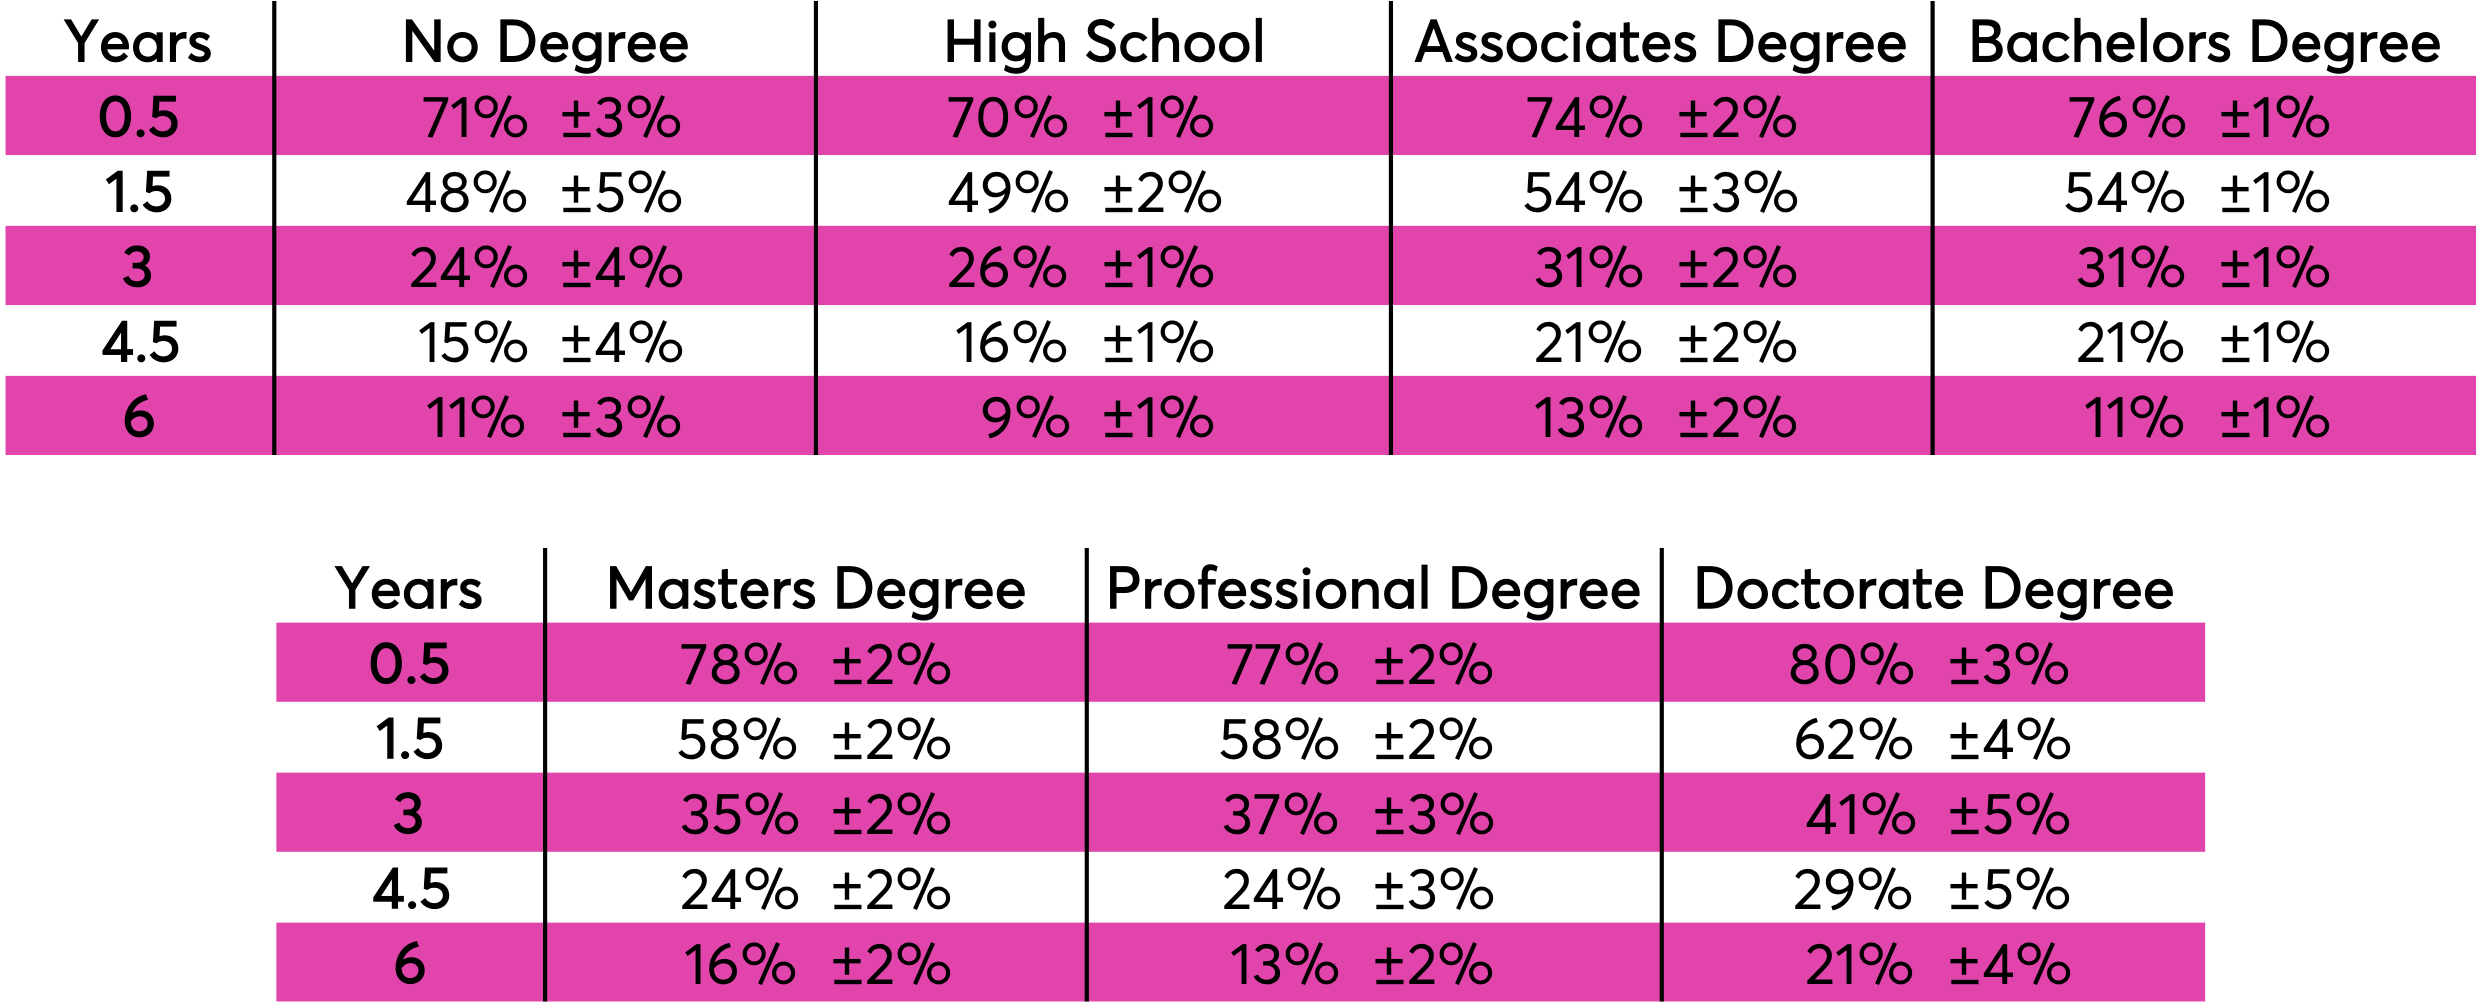
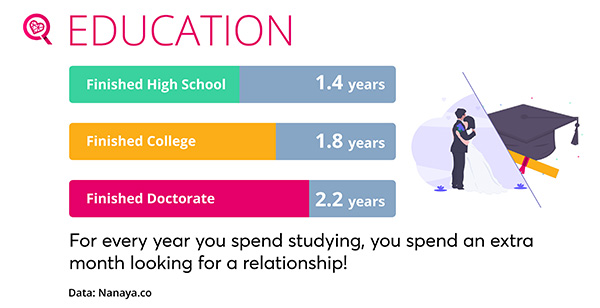
For starters, let’s just look at the average time spent single – when 50% of a population starts a new relationship and 50% stays single.
Table 5. Average time spent single based on approximate years in school.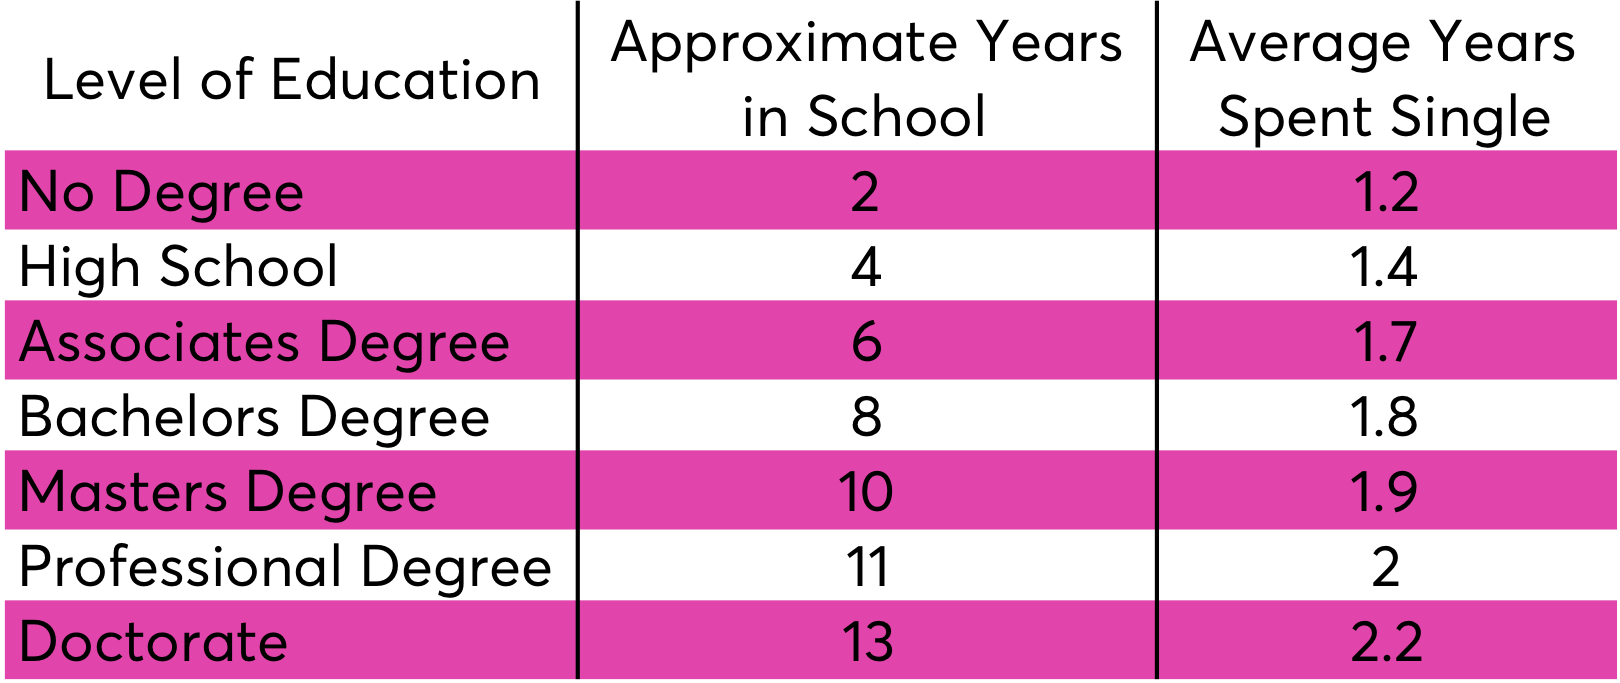
Note that our assumption for “Approximate Years in School” is somewhat arbitrary for “No Degree” and “Professional Degree”, which represent a range of possible years of schooling. That said, when you plot these points you notice an unmistakable linear trend:
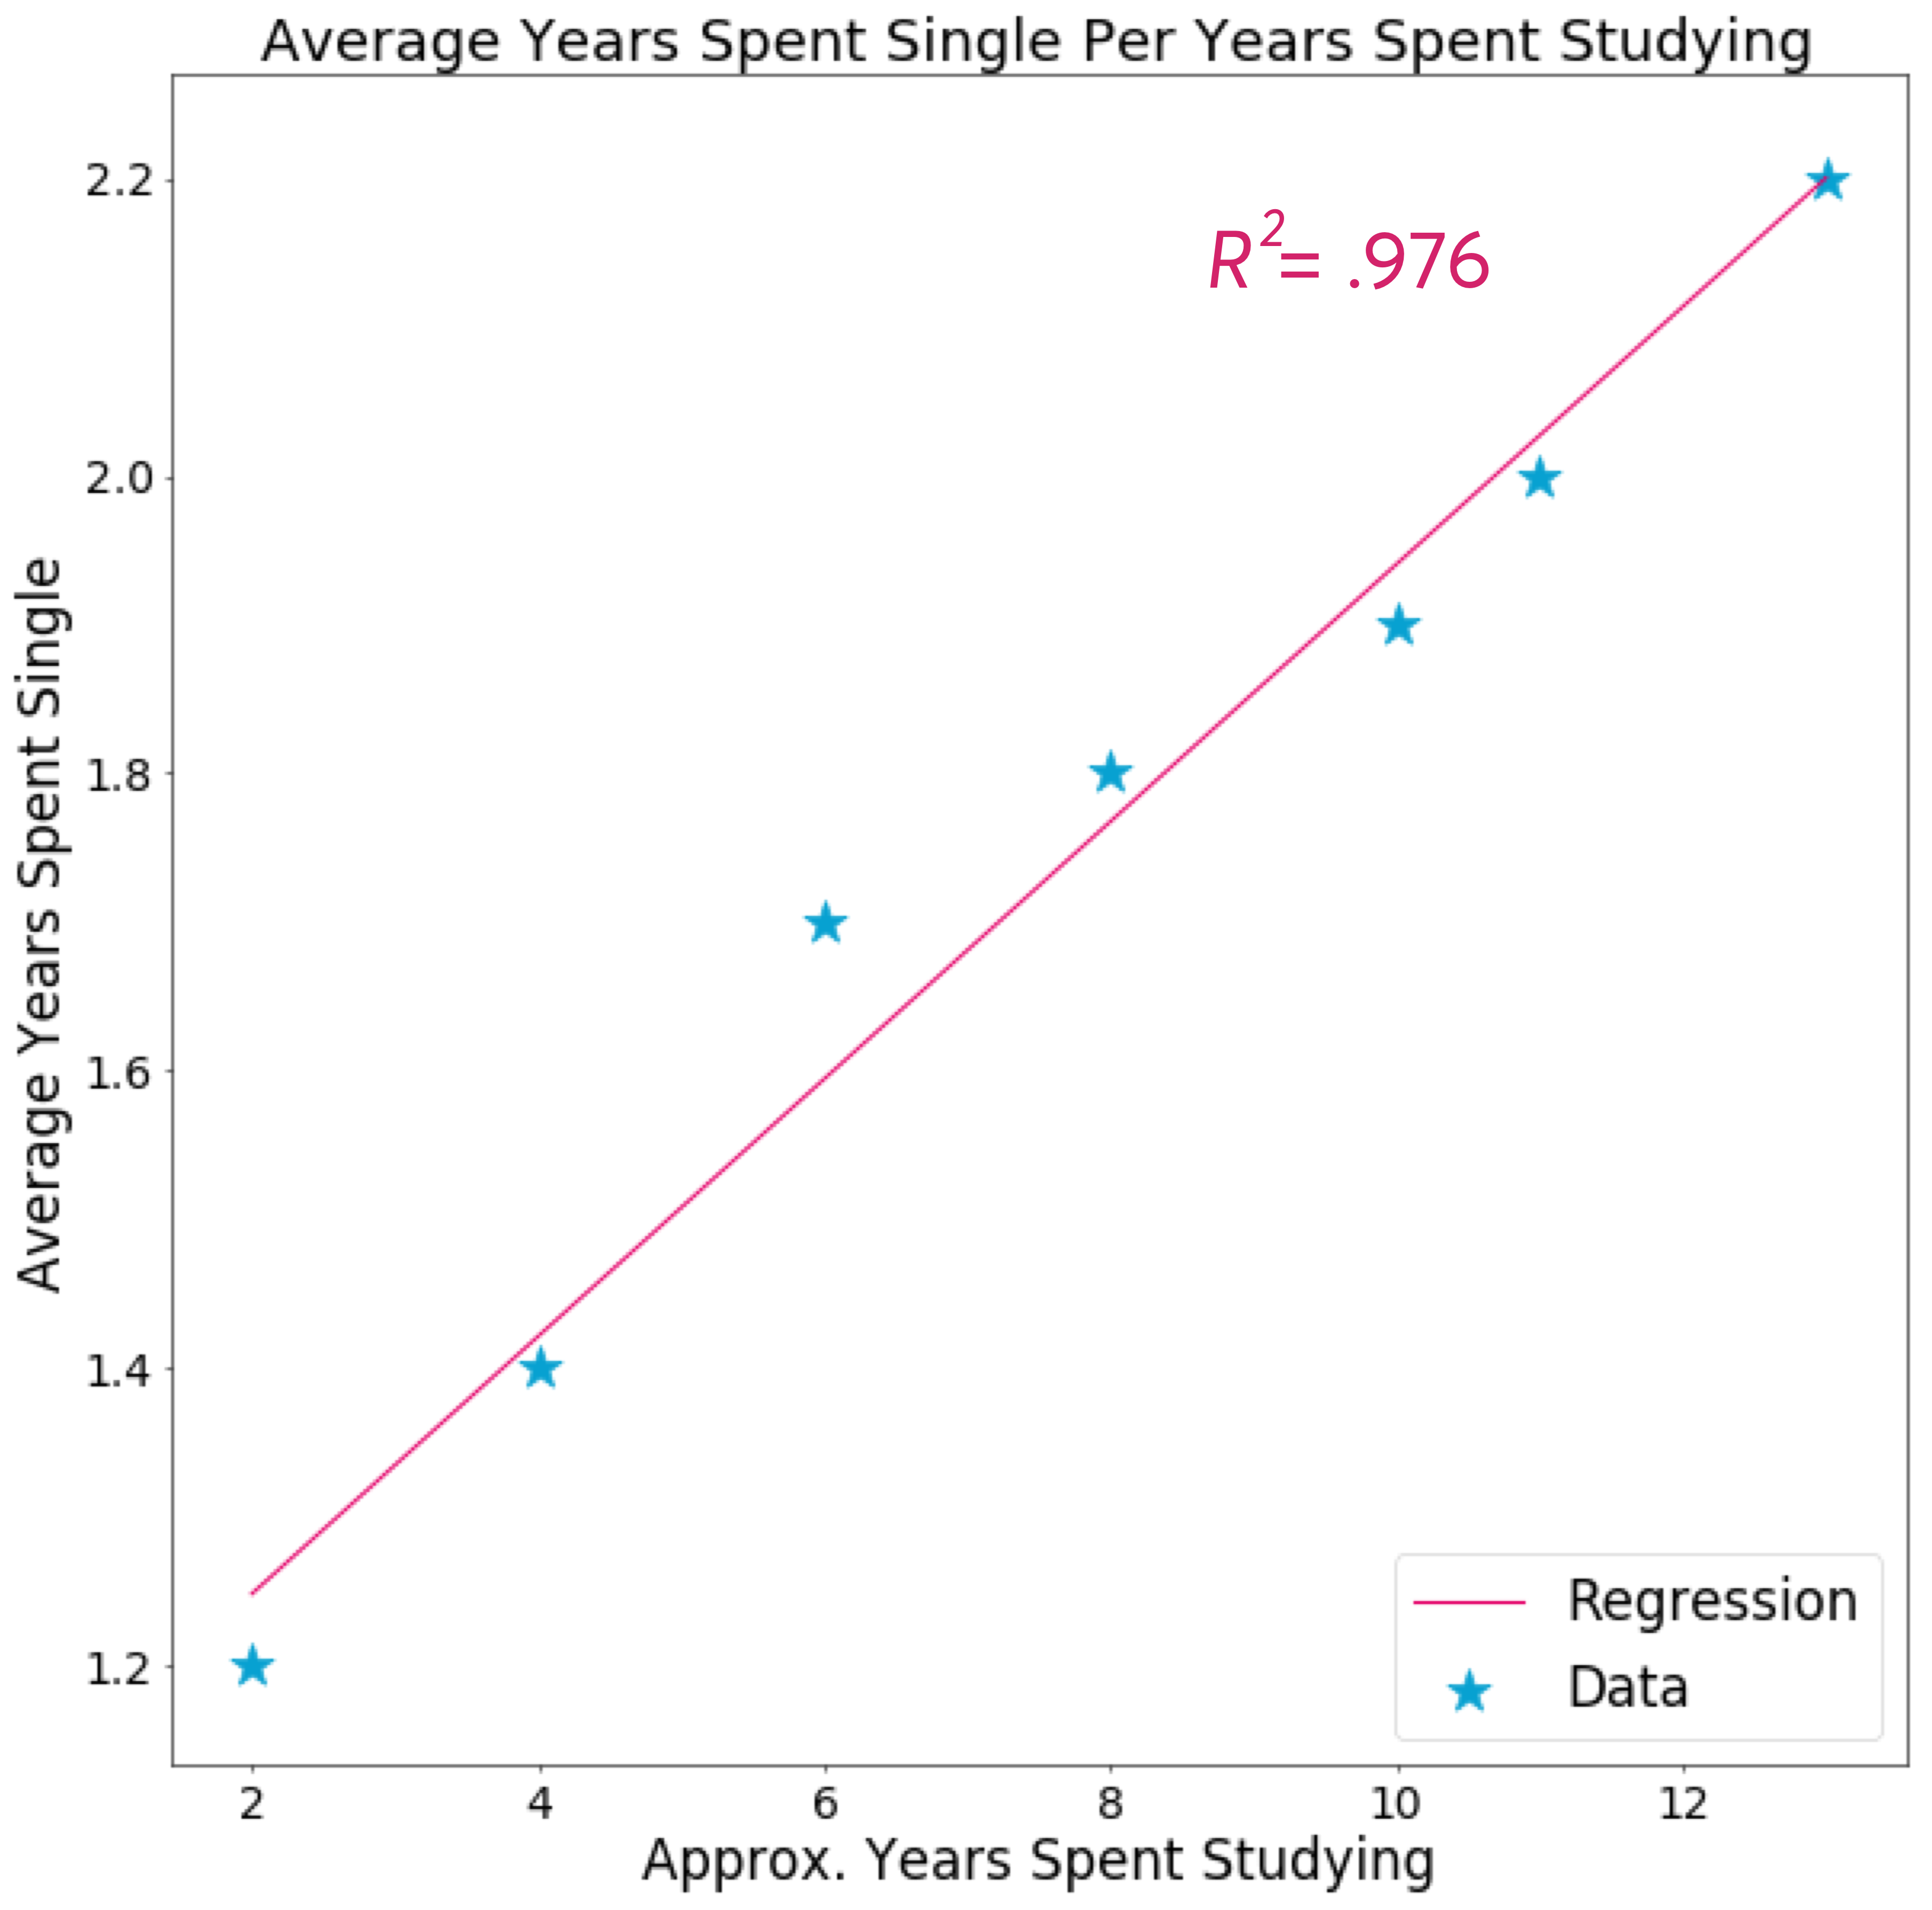
The equation for a line that connects the data points has a slope: 0.0865 years spent single per year spent studying. This means that for every year you spend studying, you spend almost exactly one more month single after a relationship. This might be good to mention this to demanding parents who want you to go for a higher degree while also wanting you to get married!
Religion & Religiosity
Nanaya asks users about their religion and religiosity to best understand one’s identity and values.
In the case of the case of the survival analysis performed in this study, we need a lot of data to offer results that we are confident in. As you can see in this report, we want to offer highly confident results that are complete. Although our study was performed using data from about 50,000 users – not enough people of minority religions offered complete enough information to perform this analysis with confidence. That said, we have more than enough data to understand the effect of religiosity irrespective of religion!
Gauging people’s relation to religion is tricky, because it’s couched in identity and is contextual, based how one perceives the society they’re a part of. To square the circle, we offered four choices that describe relation to religion in terms of orthodoxy and cultural association. Orthodoxy affects the type of religious community one belongs to while cultural association indicates how significant one’s sense of religious identity is. Both of these have an impact on how and whom one dates.
So now we wonder, does someone’s relationship to their religion affect their chances at a relationship? We can form some naïve hypotheses: maybe people who are orthodox and adherent will have a stronger sense community where values are shared, leading to reduced rebound time? Conversely, maybe more conservative attitudes might inhibit free dating? I have no idea, let’s check out the results!
Table 6. Religiosity data.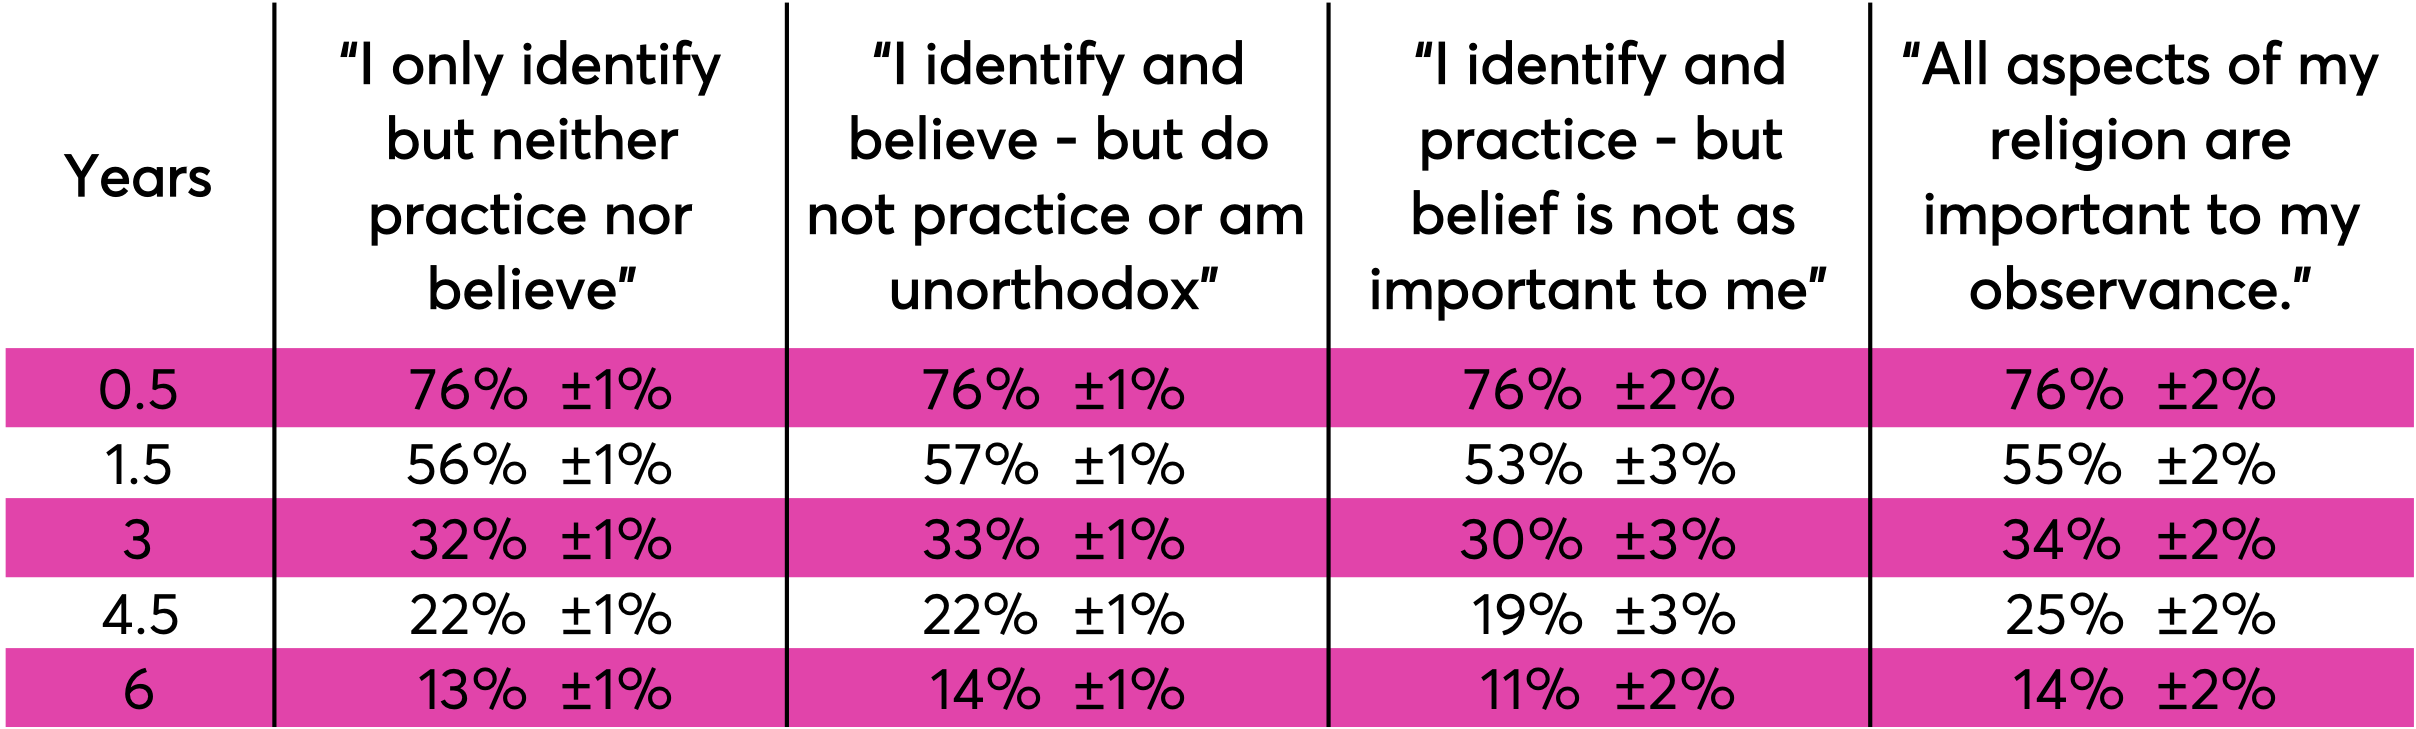
As it turns out, how someone adheres to their religion doesn’t have a meaningful effect on how long you’ll spend single.
Now there are a few things to keep in mind. First off, we’re only evaluating its effect over the whole population – independent of the religion and nation where any effect might become more pronounced. Moreover, it’s worth keeping in mind Nanaya users are by and large Protestant, Catholic, and or non-religious.
Stay Tuned!
Next week, we’ll post our results on how our romantic experiences and desires affect how long you stay single!
Until then, predict your own love life with Nanaya, now on iOS and Android!