
How long do people stay single after a relationship? It’s a question everyone has wondered at some point, but it’s a question that no one has answered.
Really, no one!
Well, here at Nanaya we predict peoples’ love lives and we’re all about using the data we’ve collected to improve our algorithms and answer THE big, unanswered questions. We studied data from about 50,000 users worldwide to answer the question: “How long do people stay single?”
But the answer varies a lot based on who you are. Is it different for men and women? Does riding the subway help your odds of finding a partner? Does someone’s views on immigration make a difference? Over the next eight weeks, we’ll be reporting on how long people stay single based on their:
- Career
Click for high resolution.
In this report, we offer scientific results. In your Nanaya Report, we offer a personal prediction of how long you stay single based on the methodologies of this report. Be sure to try it!
Summary
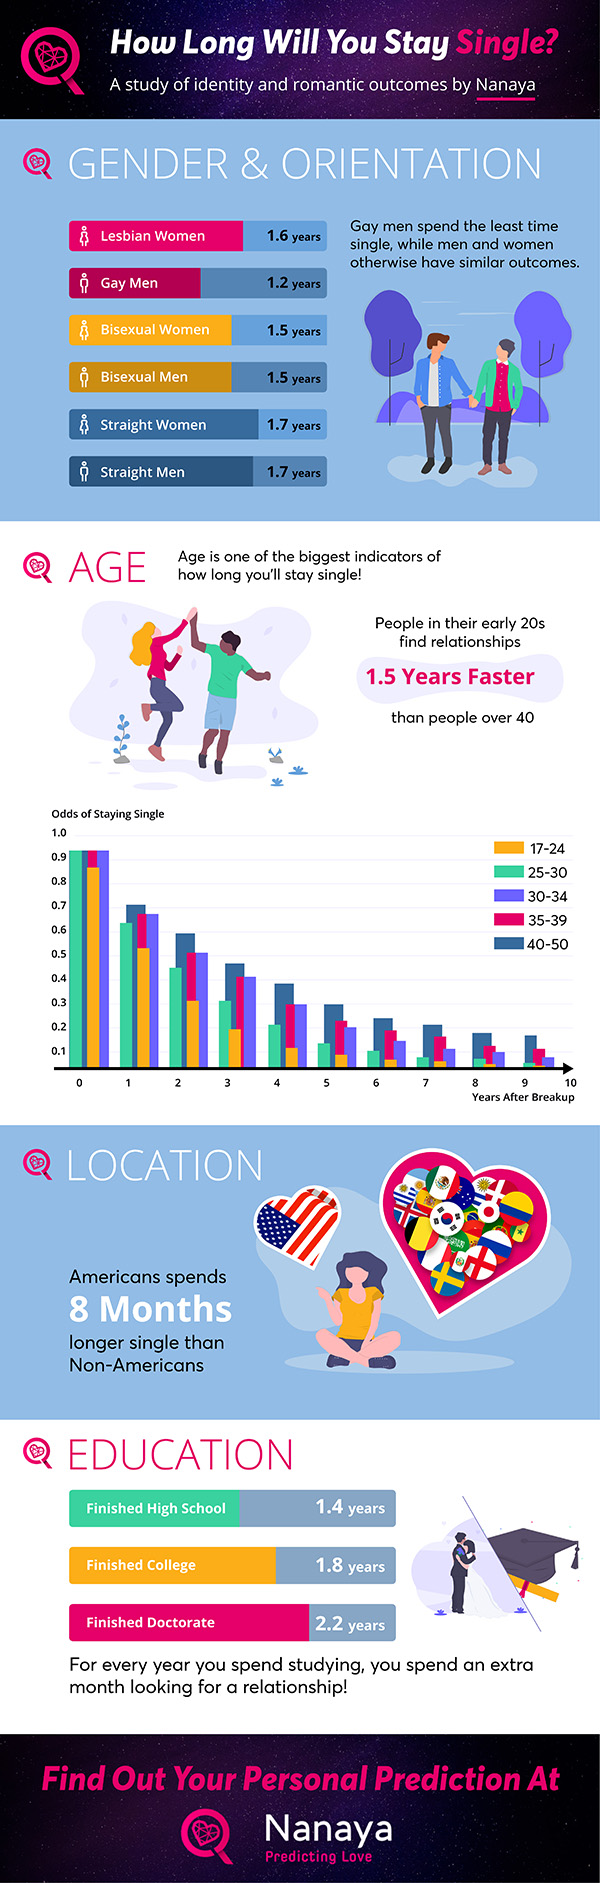
Let’s cut to the chase! Immediately after a breakup, the average person will:
- Have a 25% chance of entering a new relationship after seven months.
- Have a 50% chance of entering a new relationship after one year and eight months.
- Have a 75% chance of entering a new relationship after three years and six months.
While rebound time will vary based on the individual and their circumstances, there is a very strong relationship between individuals they are and their outcomes. The aspects of identity that most strongly impact rebound time (i.e. the time spent single between committed relationships) are one’s age and psychology. Of psychological traits, those associated with empathy, determination, sociability, and impulsiveness have the strongest impact.
There are notable variations based on sex and orientation. Gay men having the shortest rebound times with lesbian woman and straight sexes having the longest rebound times. There is no significant variation between straight men and women. There is also no significant variation between bisexual men and women.
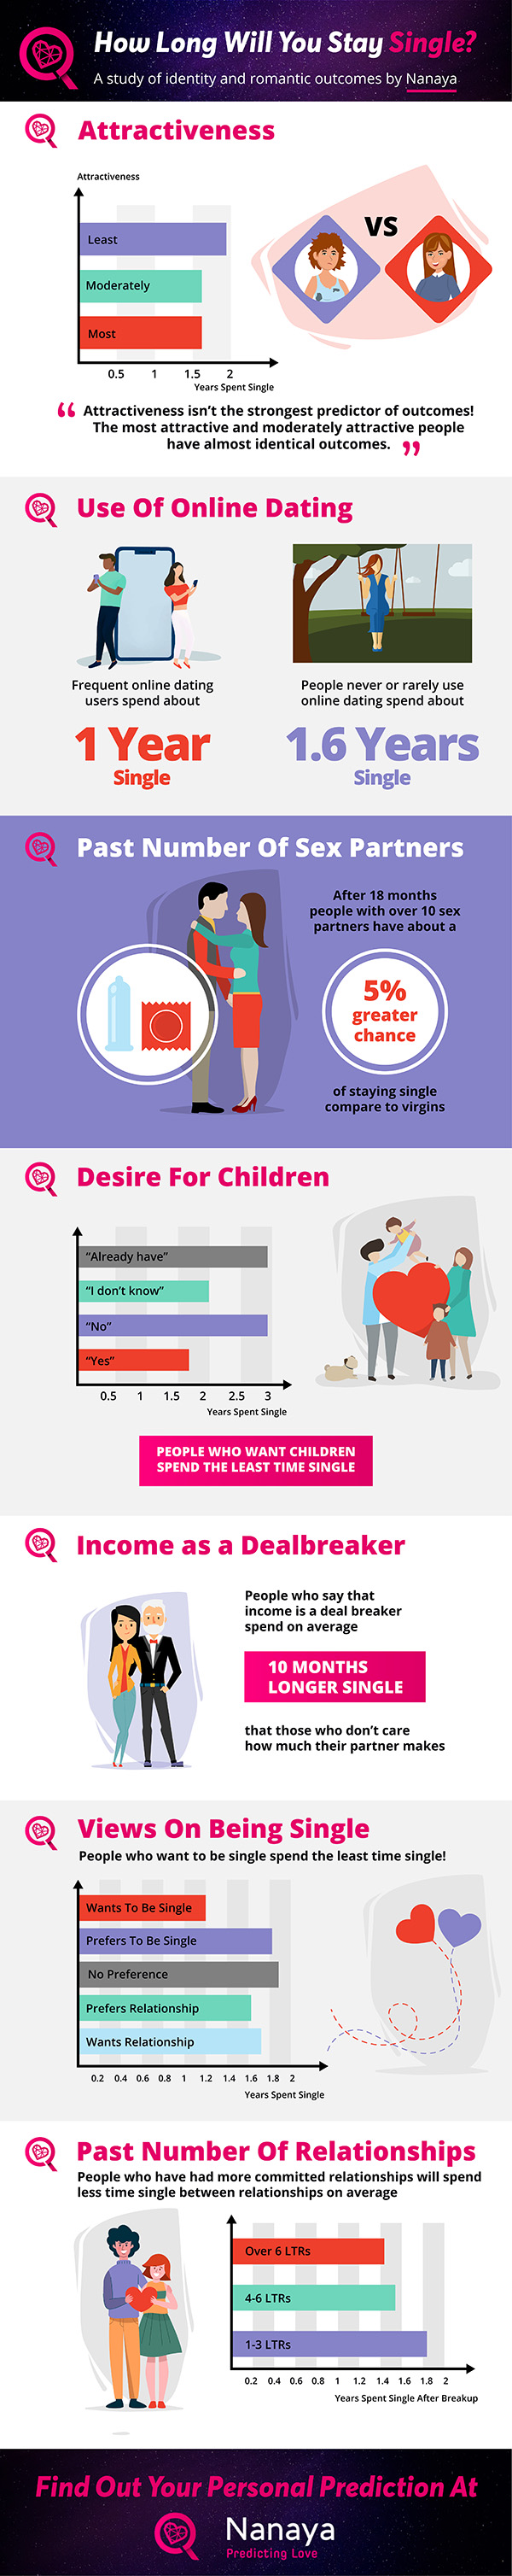
How attractive someone is has an interesting impact, where it has little impact for all levels of attractiveness to about a year and a half. After that, outcomes notably diverge. The desire for having children and personal views on being single have significant relation to rebound time. However, remarkably, past romantic experience has relatively small impact. Individuals who identify with having major deal breakers in who they have as a partner show significantly longer rebound times in most cases.
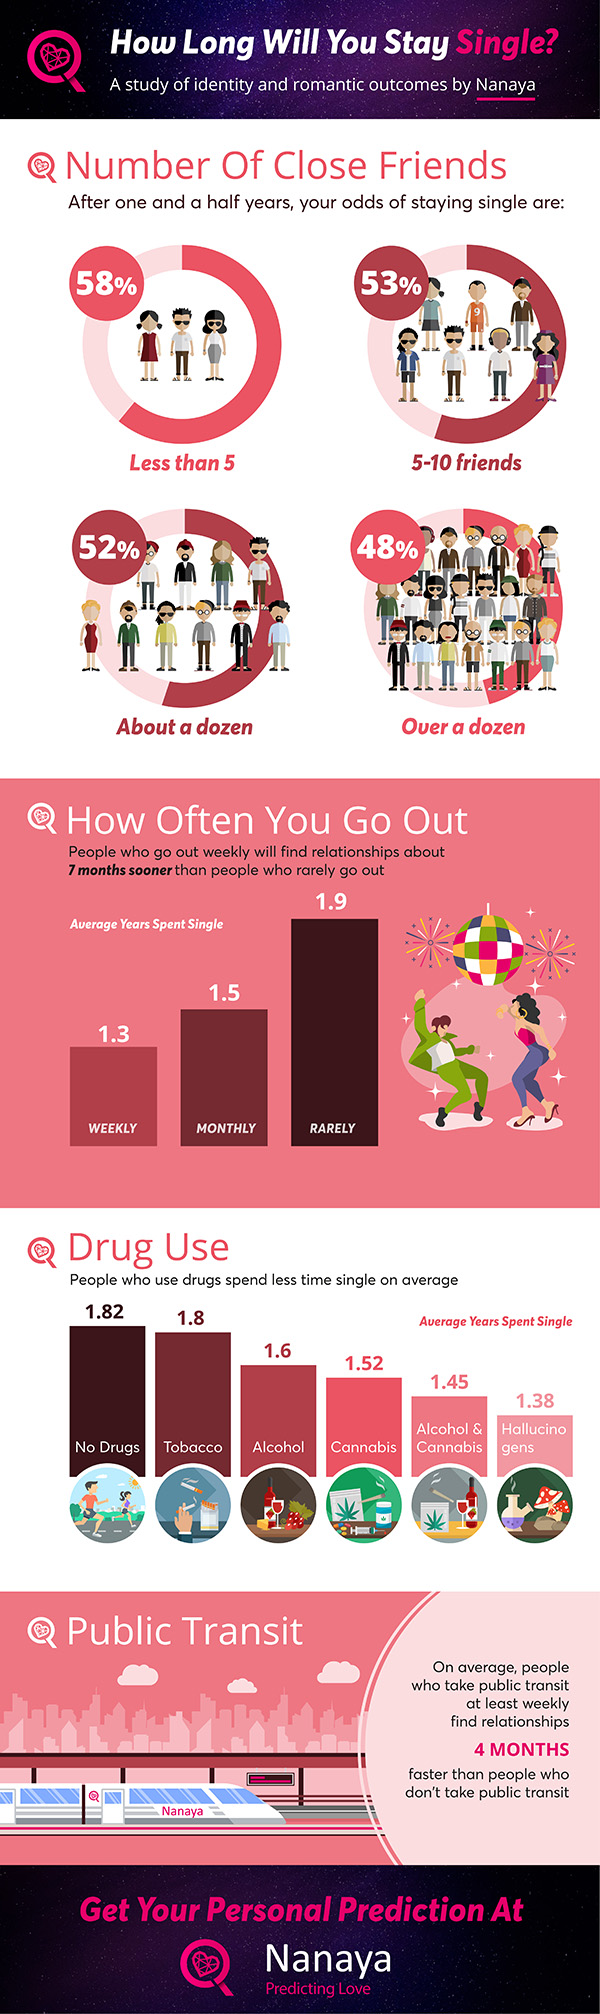
In terms of lifestyle, increases in most social aspects and behavior, such as having a large friend network, going out more, and joining activity groups correspond to generally shorter rebound times. Drug use, with the exception of tobacco, also is correlated with notably shorter rebound times. Even how you get around the city has an impact on rebound time, with shorter rebound times for people who frequently take public transportation.
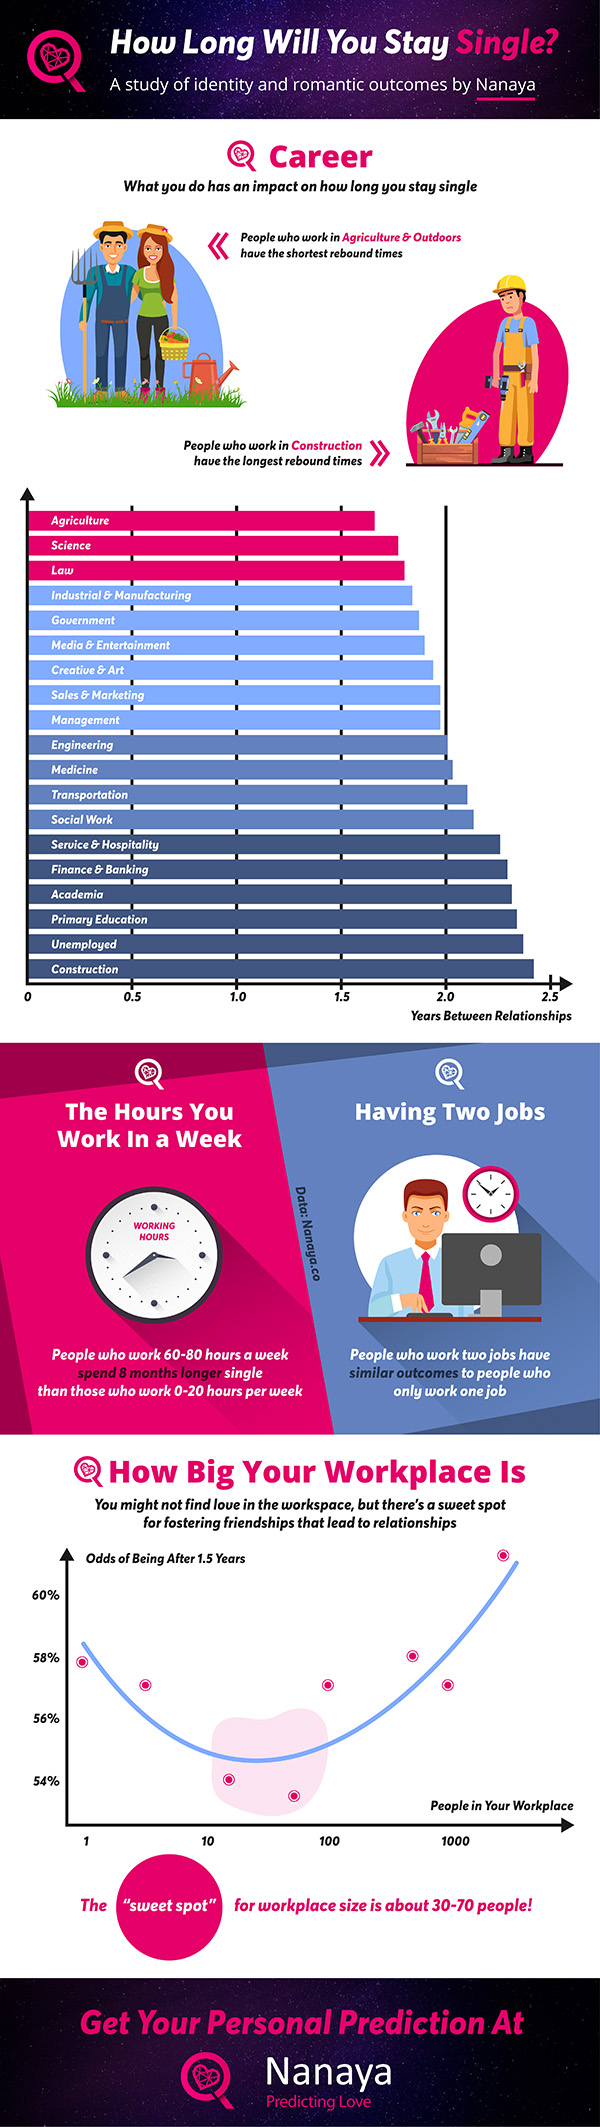
Some aspects of career have a significant impact on rebound time. There is a very strong correlation between rebound time and level of education, with every year of education, from high school through graduate school, adding nearly a month to rebound time. Conversely, career by itself generally has no significant impact on rebound time. The relationship between income and rebound time is U-shaped, with those with the most and least income having the longest rebound times.
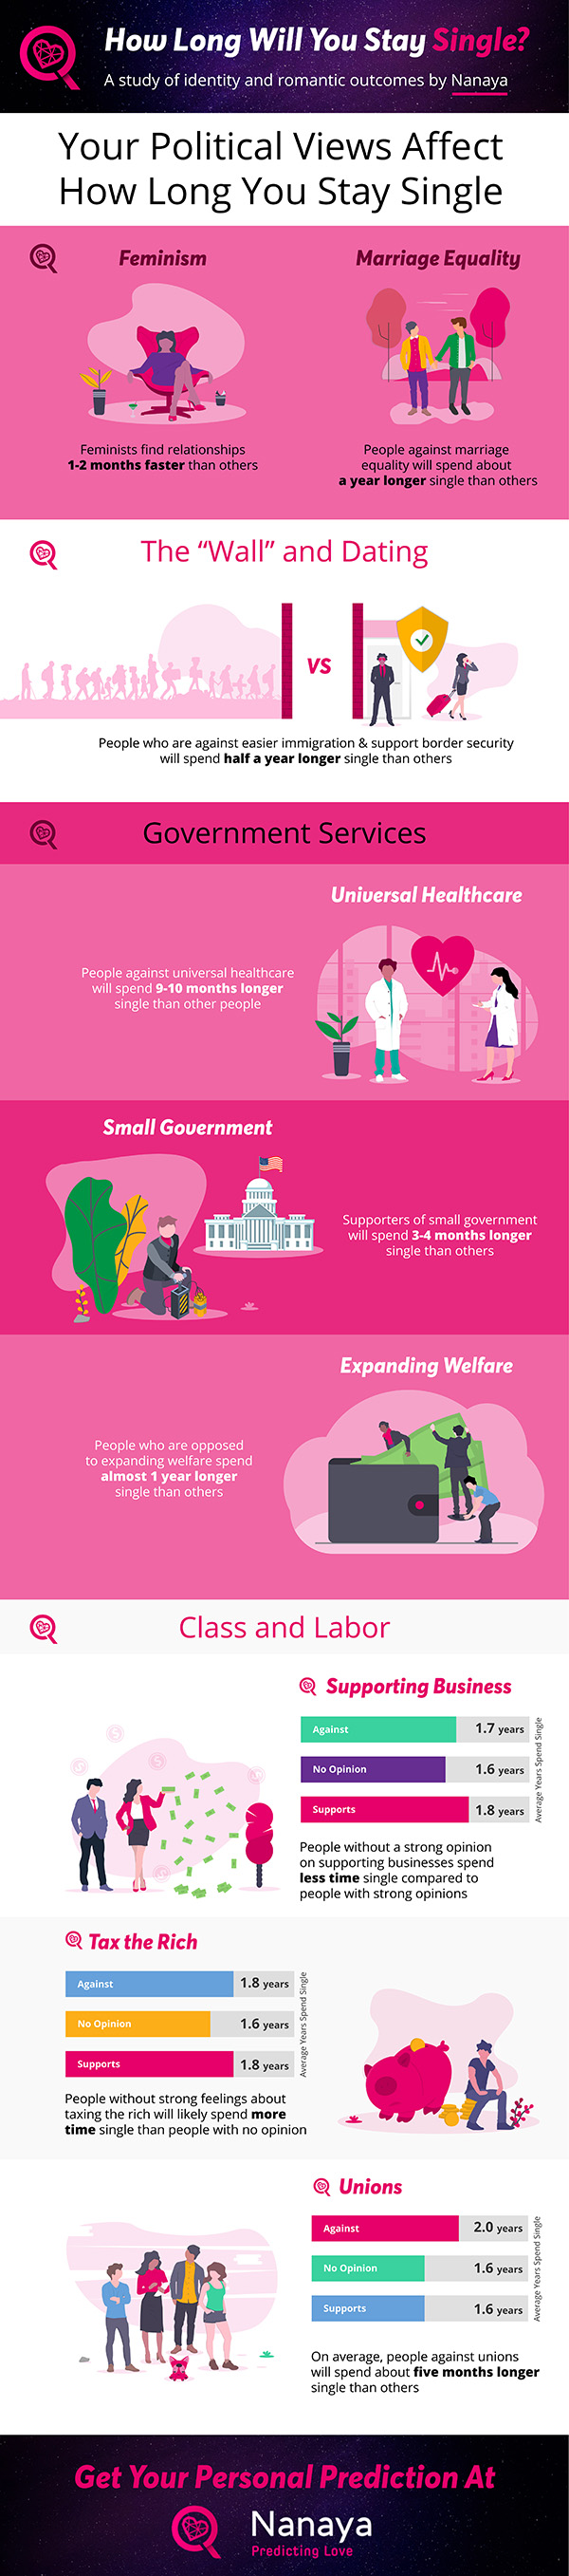
With the exception of supporting feminism, having expressed political views corresponds to spending more time single. Otherwise, people who hold political views that are commensurate with lacking empathy will typically spend over half a year longer single than others.
Most of all of these aspects of identity, however significant, have far smaller impact on outcomes than an individual’s psychology. As mentioned above, traits associated with empathy, determination, sociability, and impulsiveness have the strongest impact.
What does “staying single” mean?
“Staying single” means a lot of things. The exact answer is whenever a user says they’re single. This can mean a lot of different things. For many people, it means dating and not dating before finding a monogamous partner. For some people, having a monogamous sexual partner doesn’t necessarily imply a relationship. For others, being single can mean not even dating. Similarly, while some people prefer to be in a relationship, others don’t. In fact, in this study we show that people who don’t want relationships can do a very good job of starting them!
So it’s important to understand not everyone’s version of “being single” is the same when evaluating these results.
Understanding results
The results of this report are based on something called survival analysis, which is commonly used in biostatistical studies. The results of survival analysis show what proportion of a population “stays alive” as time progresses.
In our case, our population is single people and “staying alive” is “staying single”. Our results will indicate the percentage of a population staying single after a certain amount of time. For instance, if 100 people are single and the survival rate is 40% after two years – that means 60% of people have found committed relationships. We also identify the 95% confidence interval associated with each result as plus/minus the survival proportion.
If you look at the actual results of the survival analysis it looks something like this:
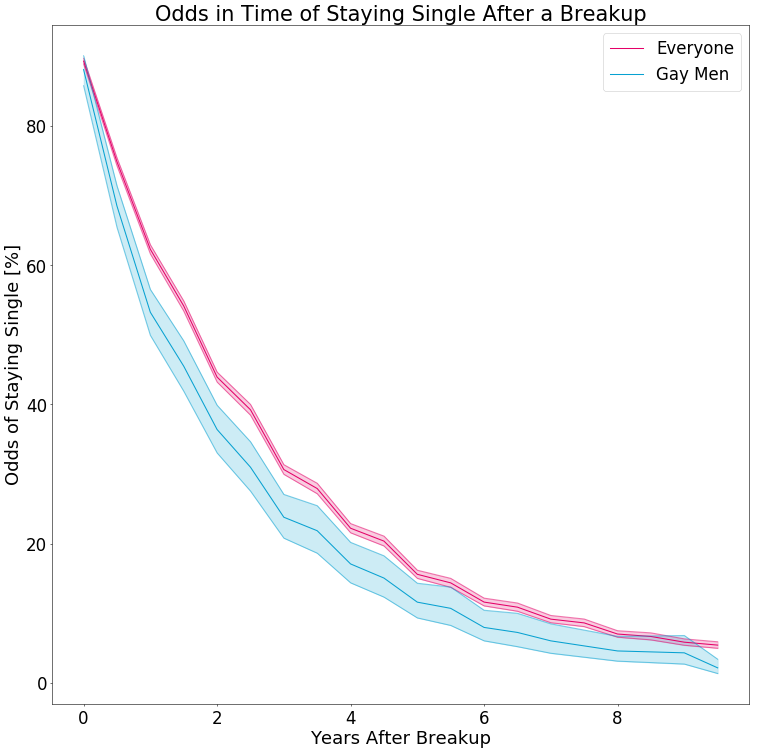
Here, we’re comparing the outcomes for the general population, in pink, and gay men, in blue. There are two things to notice. First, gay men have a curve that is below the one for the general population, indicating that gay men are more likely to reenter relationships sooner than the general population (which also includes gay men). The shaded regions indicate the 95% confidence interval. You can see that gay men have a larger shaded region, indicating that there is less statistical confidence in this prediction than in the general population, owing the much larger size of the general population.
Nonetheless, because the confidence intervals don’t really overlap we can say with certainty that gay men will on average spend less time single compared to the general population.
If you want to find out how much more, keep reading!
Minor notes before we continue…
In our report, we mention the difference in time, months or years, people stay single between two or more groups. When we do this, we are referencing the difference in the average amount of time that people stay single unless otherwise stated. To be precise, it’s based on the “50% single survival rate” of that group.
Our results are based on Nanaya users. Our users include people who are single, in relationships, and married. Our users are from all over the world. The two key things all Nanaya users share is that they’ve heard of Nanaya and are sufficiently interested in Nanaya’s ability to predict their future and offer personal insight. Thus Nanaya users are not random a sample. Additionally, to perform and control for this analysis, only data from users who answered a complete set of selected optional questions was used in this study. This introduces another element of sample bias.
Despite the sources of bias, we are confident that these results are generally descriptive of society. However, this is the only study that has even been conducted on this subject and we welcome any additional research.