
Starting a dating site is a lot of work. If you do it, you better hope there will be enough users that want to use the service you provide. There are a lot of dating apps that appeal to everyone, but what if your identity and personal values are so strong that you really want to date someone with a specific identity? For that reason, there’s a market of dating sites that aim to support religious and immigrant communities, people with different kinks, and also people with strong political views.
Because politics dictates how many people date in impactful ways, Nanaya needs to assess people’s political values to reasonably model romantic outcomes. Serving the global community, we developed a list of political views that offer variety of choice in expressing support or opposition to values that are pressing issues across the world – not just in the United States.
In the past few posts, we’ve looked at how different aspects of our identities affect how long we stay single between relationships. In this post, we’ll find out how our political views affect our love lives.
In last week’s post, I detailed how aspects of our careers, like our professions or the size of our workplace, affect our chances at finding a partner. If you like this post be sure to check it out along with the others in this series.
It’s worth repeating is that these results are based on Nanaya user data. In this week, we only look at users who are over 25 years old around the world. This means not every users selecting the same political view will have the same interpretation of what it means as its context will vary by local culture and politics. Moreover, we don’t determine what it means to be single or in a relationship – our users do. So the best way of understand what “single” means here is the time between when people say they’re in a relationship.
These are also pretty general results! You can get personalized results by trying Nanaya for free today!
Feminism
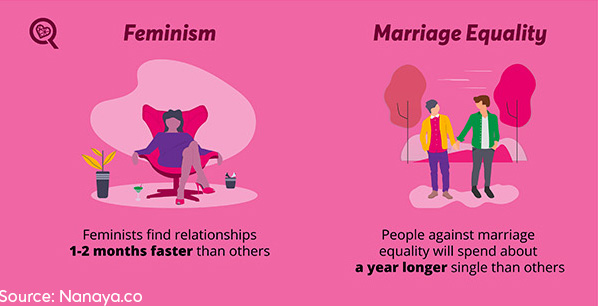
People who support feminism will spend on average almost two months less time single between relationships than people who do not actively support feminism.
Table 1. Feminism data.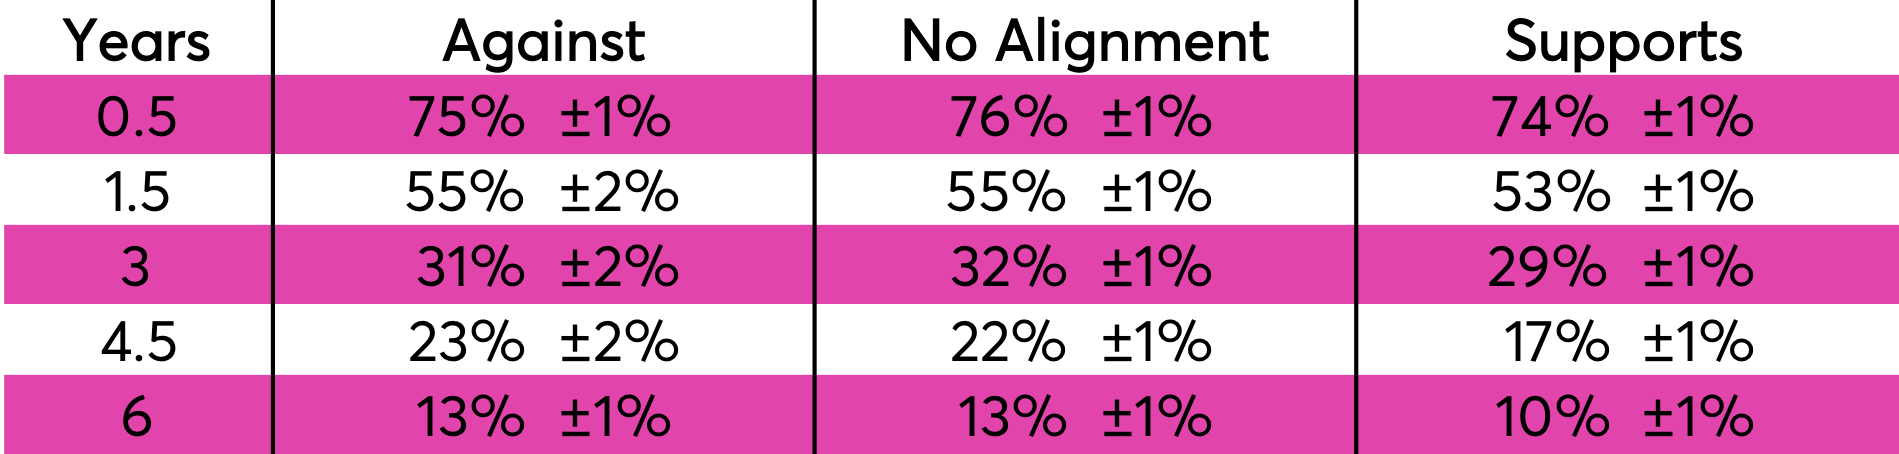
Marriage Equality
People who are against marriage equality will spend on average between five and six months longer single than people who are not against marriage equality.
Table 2. Marriage equality data.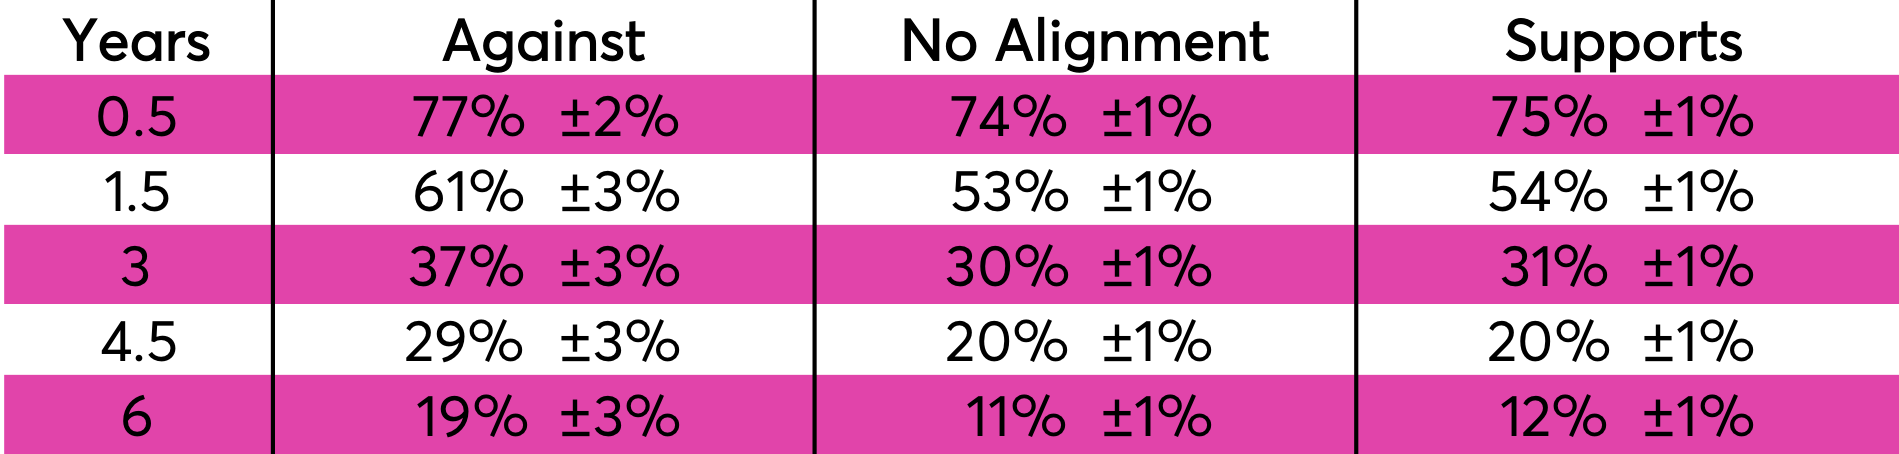
Tax the Rich
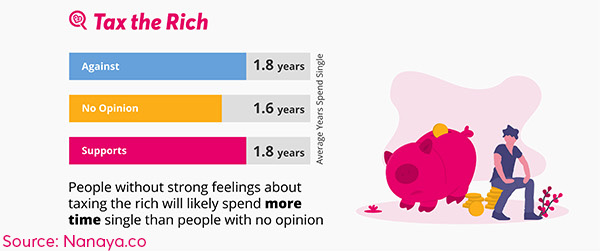
There is little variation in outcomes for people with different views on taxing the rich. The variation that exists is again U-shaped, with people expressing polar views spending slightly longer single on average compared to those without a strong view.
Table 3. Tax the Rich data.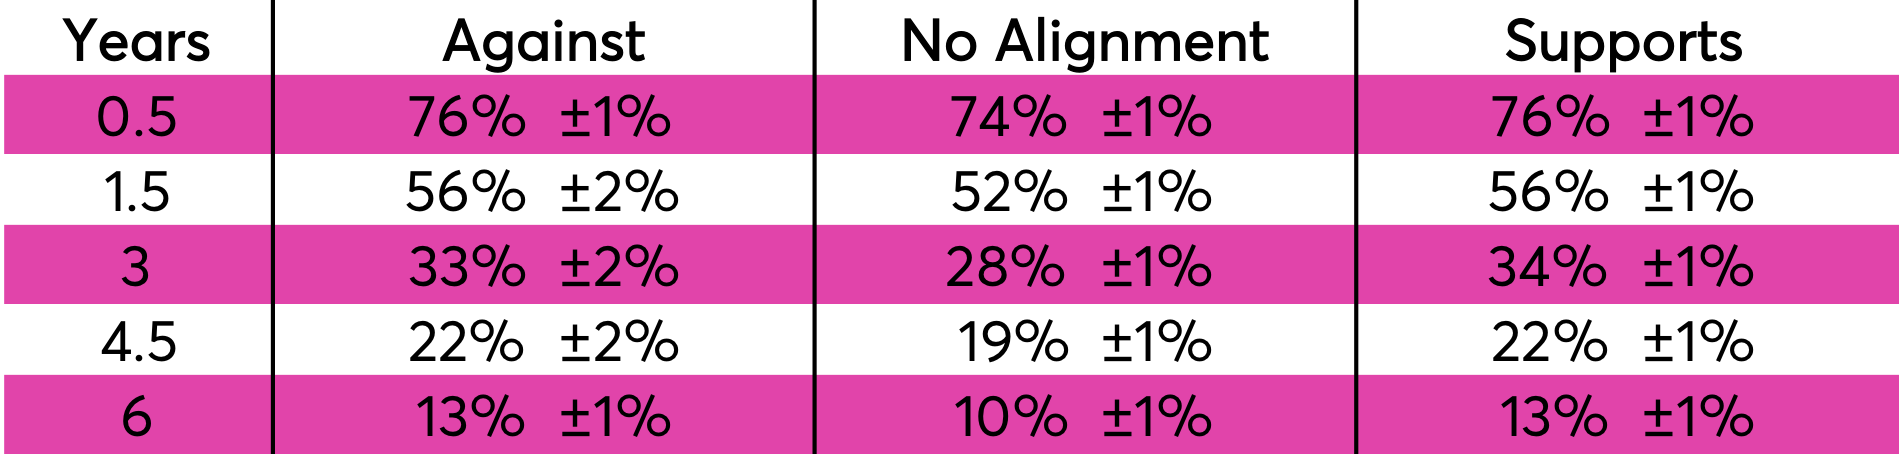
Pro-Choice
Another uncommon U-shape, where people with no alignment spend the least time single compared to those who are for and against a woman’s right to choose whether or not to keep a pregnancy.
Between those who are and are not pro-choice, there is uncertainty in outcomes with the 95% confidence intervals overlapping but the trend over all time intervals in unmistakable. There appears to be a slightly lower average rebound time for those who support a woman’s right to choose as opposed to those who don’t.
Table 4. Pro-choice data.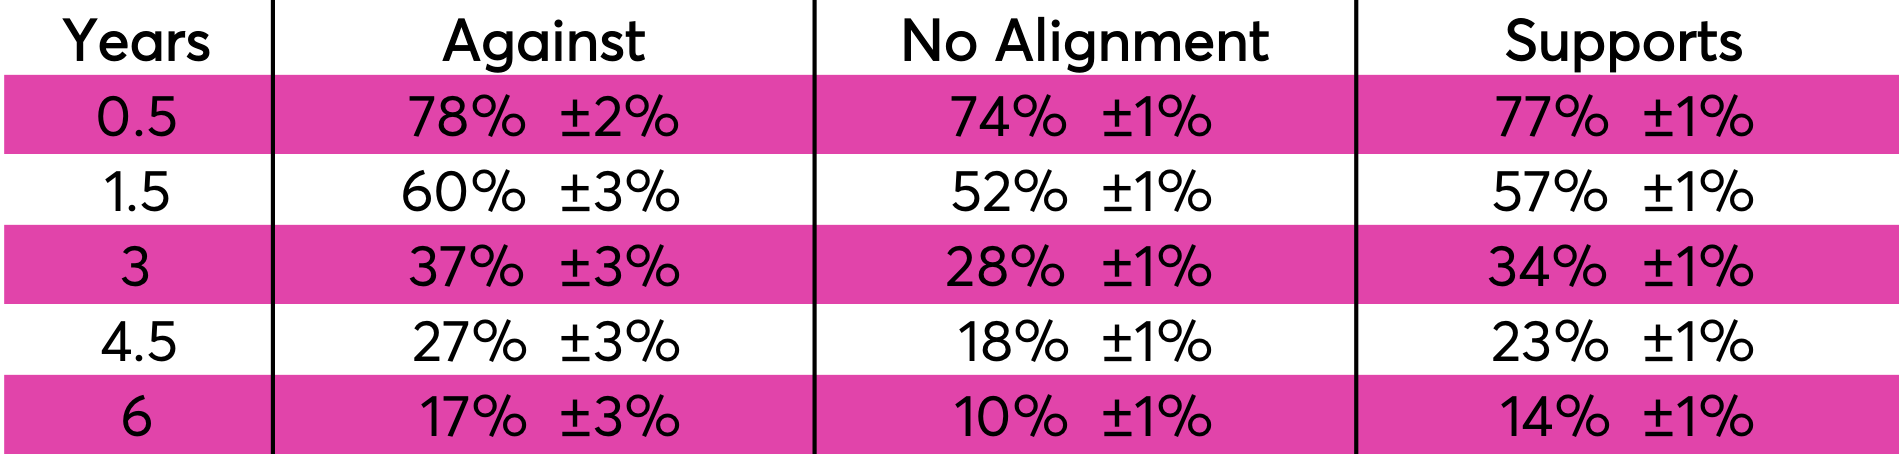
Small Government
People who support small government spend between on average three to four months longer while single than people who do not support small government.
Table 5. Small Government data.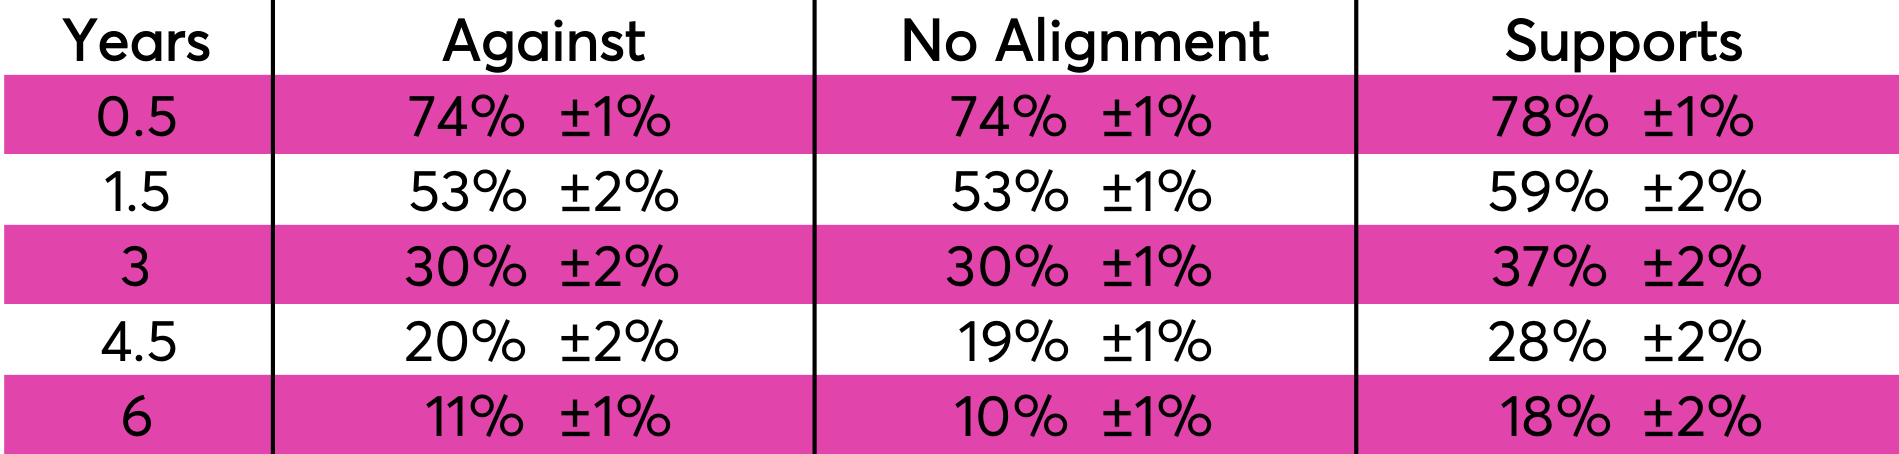
Expanding Welfare
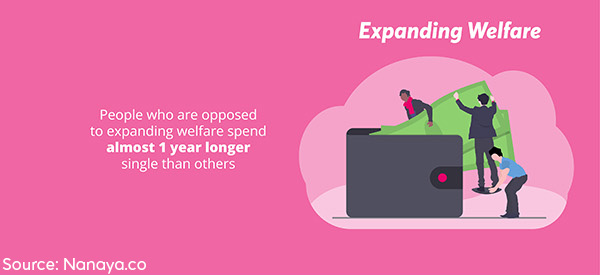
People who are against extending welfare will spend on average about 11 more months single than people who are not against extending welfare.
Table 6. Expanding Welfare data.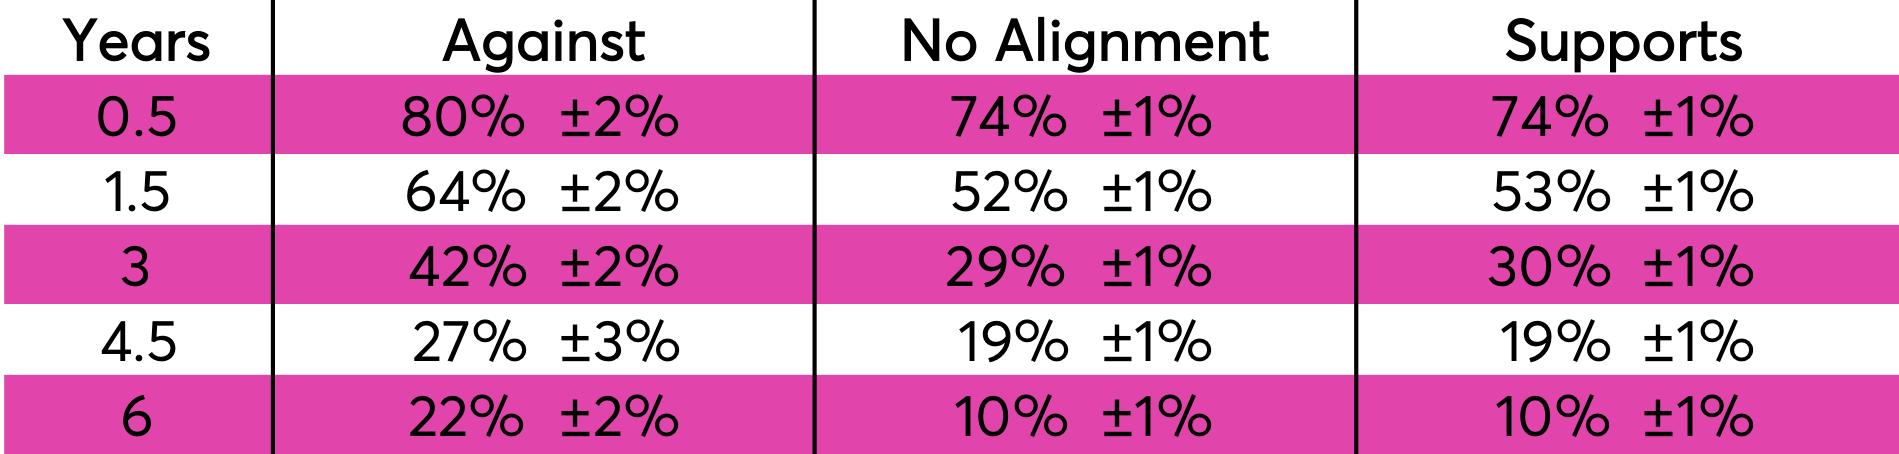
Universal Healthcare
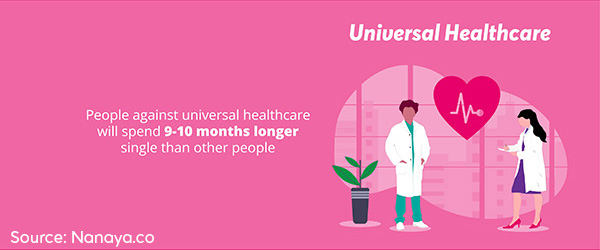
People who are against universal healthcare will spend a little less than a year longer single than others.
Table 7. Universal Healthcare data.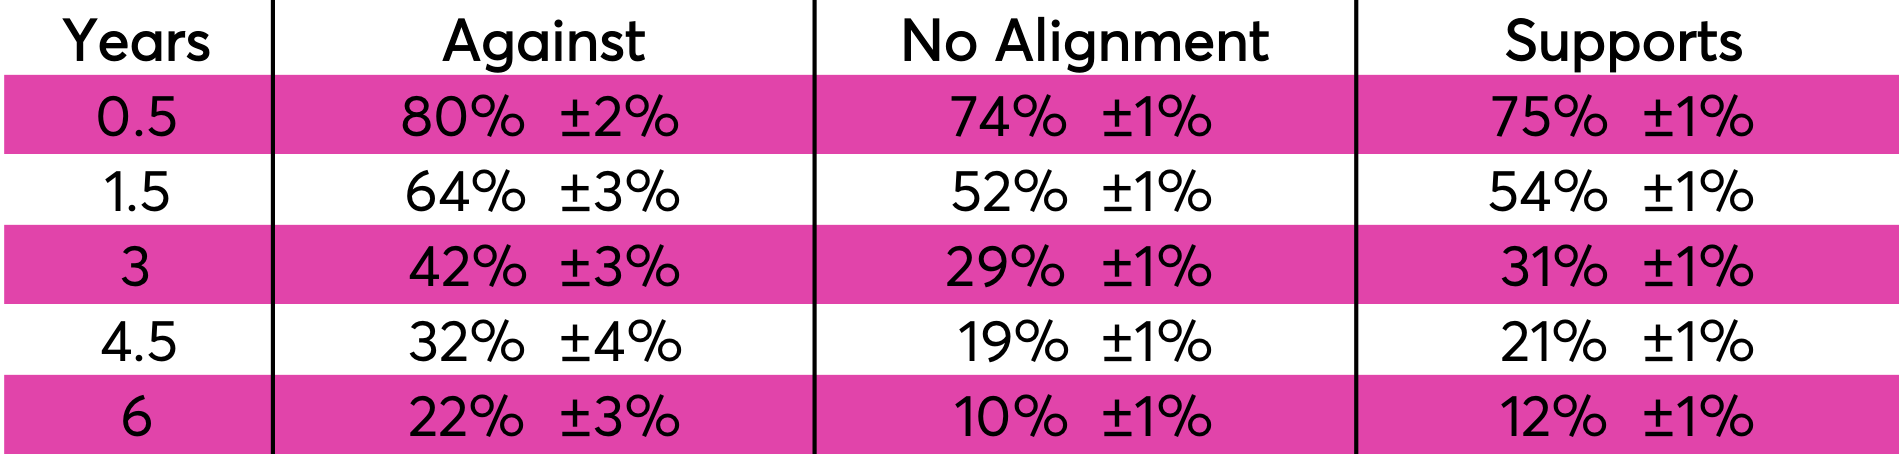
Unions
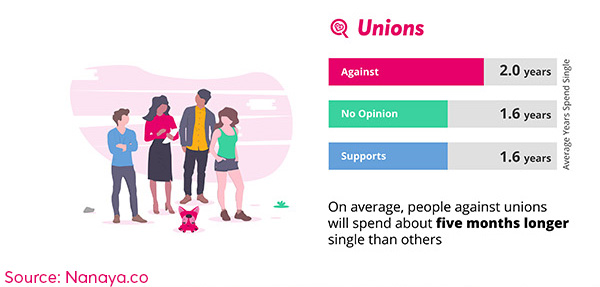
Those who are against unions will spend on average four more months single than people who are not against unions. People who are have no strong views on unions and those who support them have nearly identical outcomes.
Table 8. Unions data.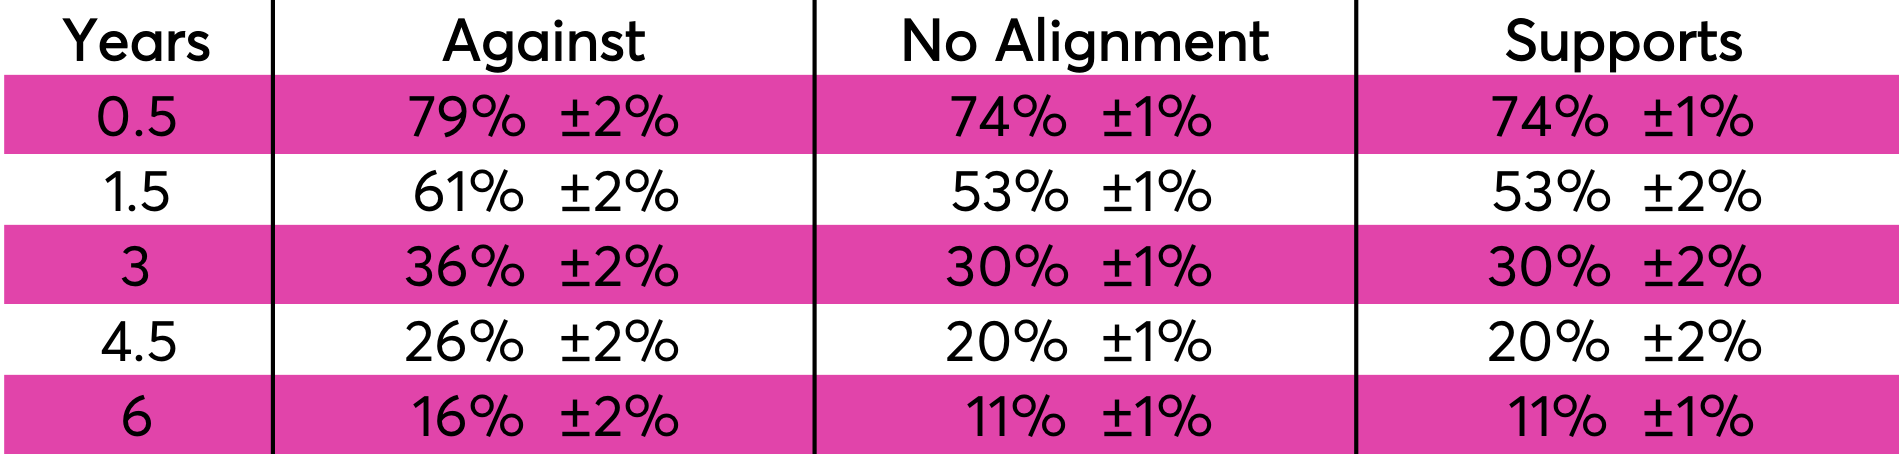
Supporting Business
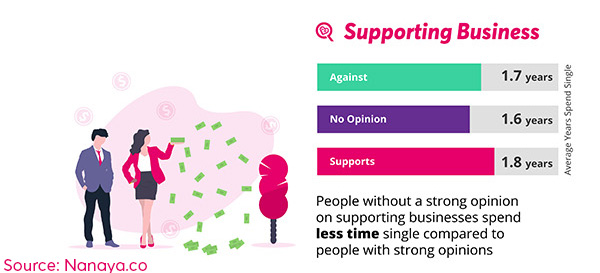
There is little variation in outcomes based on whether or not someone supports business. The variation that exists indicates another U-shape where people without strong views on supporting businesses have shorter average rebound times.
Table 9. Supporting Business data.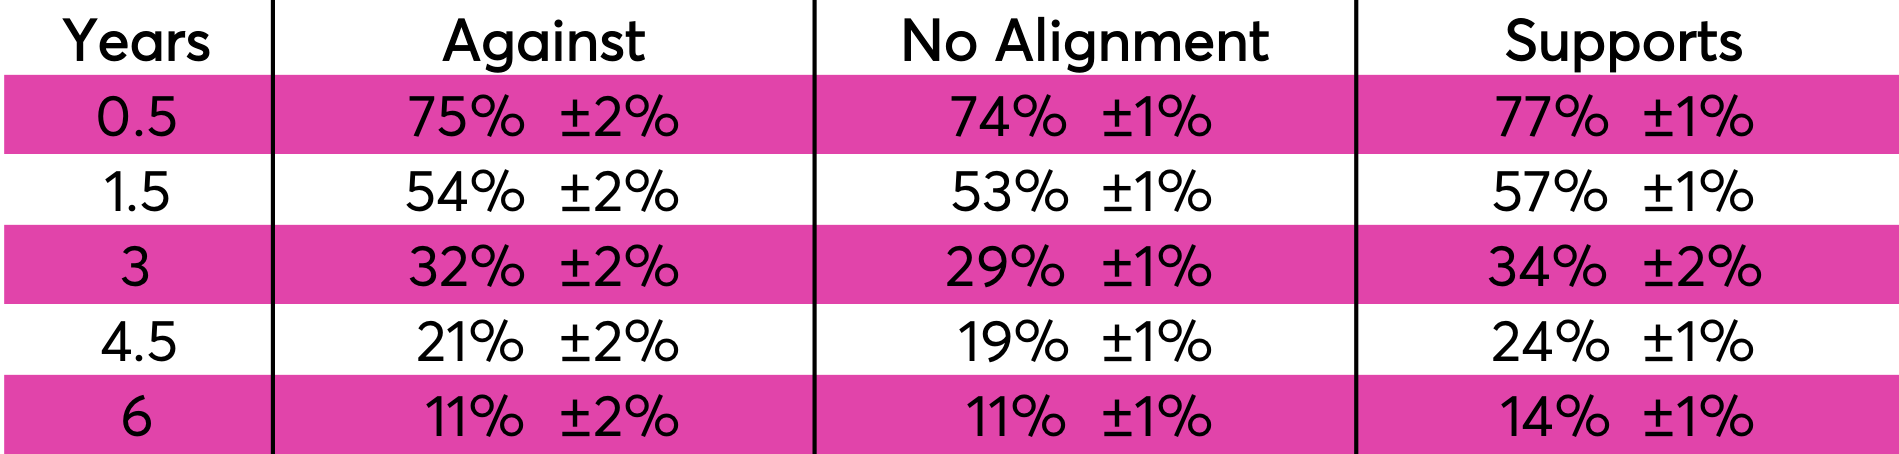
Border Security & Immigration
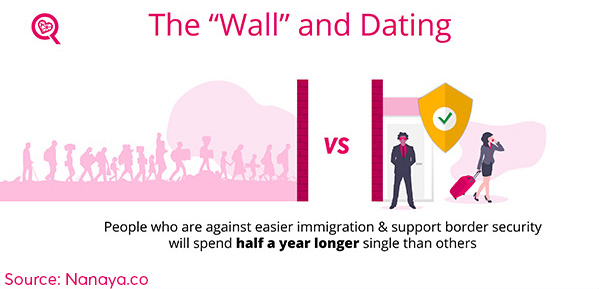
People who support border security will spend on average between five and six months longer single than those who don’t support border security.
Table 10. Border Security data.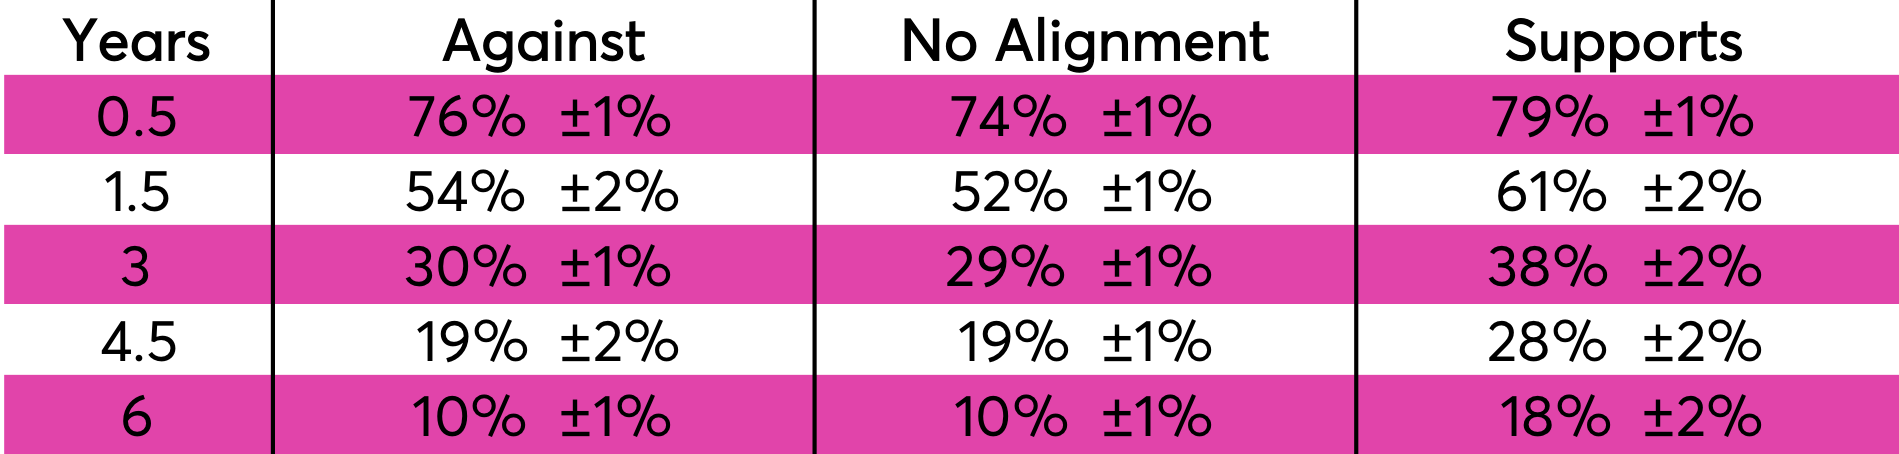
We also included the political value “Easier Immigration,” partly as a self-consistency check as it can be understood to oppose to “Border Security”. We see that the relationships are indeed reversed.
Table 11. Easier Immigration data.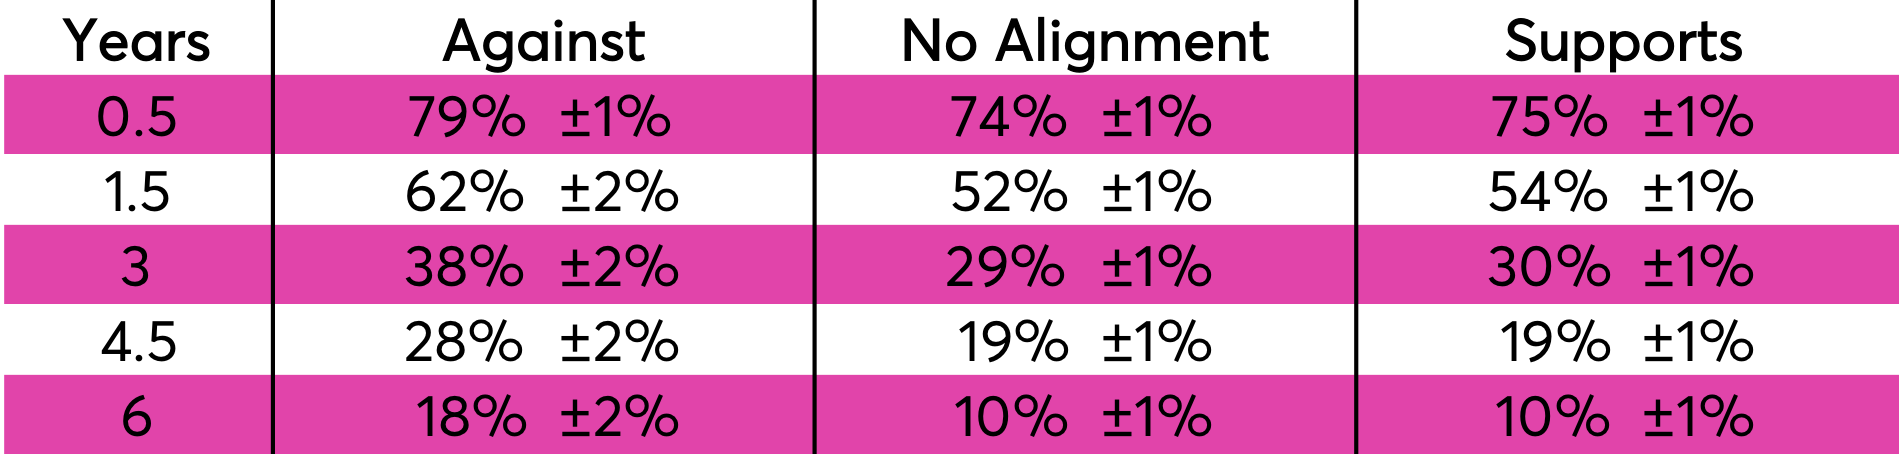
Analysis & Discussion
First and foremost, the results imply that political values are strong indicators of romantic outcomes. The observed variation in outcomes is larger than nearly all other aspects of identity we’ve evaluated in this report up till this section. The question becomes: are people turned off by political views so some people are “punished” by staying single longer or is there a deeper, underlying phenomena?
For some people, the immediate reaction is to categorize the results between outcomes of people who hold traditionally “conservative” or “liberal” views. This is a bad idea for many reasons. First, because it generalizes specific viewpoints in a subjective and arbitrary way, introducing bias intro interpretation. Second, because by skipping past actual analysis you run the risk of missing deeper relationships in the data.
Instead, we’ll categorize these results based on the relationship between rebound time and personal political value. The table below has the rebound time in years for each political value and alignment, ±0.04 years.
Table 12. Average time between relationships, in years, for different political alignments on different political views.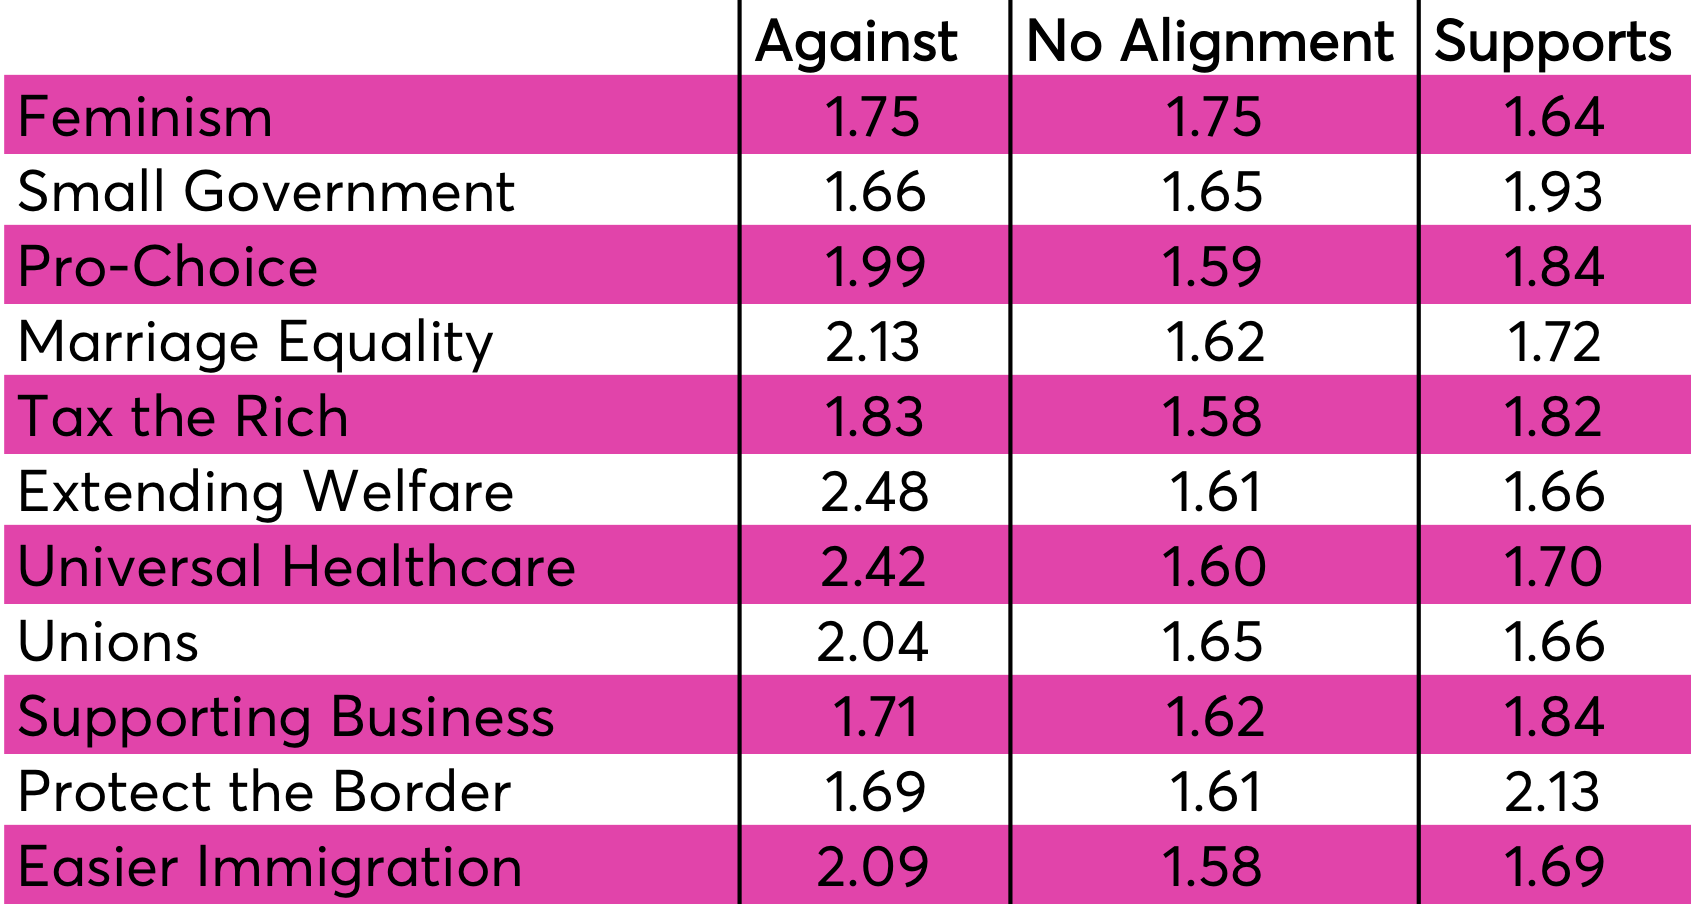
We can immediately draw one conclusion: for most beliefs, people without strong political beliefs will find partners sooner on average.
While we can’t prove causation in a retrospective study like this, we can come up with some potential reasons. The first one is that someone with strongly held beliefs will tend to alienate others who don’t share them – reducing the number of people that would be willing to date them. At the same time, not having strong beliefs on a political topic is less likely to alienate others. Even if two partners don’t share the same political beliefs, or level of commitment toward them, it doesn’t mean they can’t bond on other shared views. So it would tend to advantage people to not have strongly held beliefs.
People without strong political beliefs will find partners sooner on average.
But this doesn’t explain everything and some questions remain. For instance, if you look at feminism, unions, and small government this rule doesn’t seem to fit. In general, why do some political alignments spend almost the same amount of time between relationships as those without no political alignment? Can we construct a pattern that can help us understand potential that can help us come up with some potential explanations? If so, it might be possible to come up with a more general theory on how political views impact dating.
We can observe three unique, qualitative categories based on the shape the data takes when plotted:
- Outcomes where people with strong political views have significantly longer rebound times than the opposite political view or No Alignment
- Outcomes where people without strong political views have significantly shorter rebound times than those with a strong political view (U-shape)
- Outcomes where people with strong political views have significantly shorter rebound times than the opposite political view or No Alignment
Now let’s refactor our table and divide it between these three categories and try to understand how all political views within these categories are related.
Category 1: Outcomes where people with a strong political view spend significantly longer periods single than the opposite political view or No Alignment (hockey stick)
Table 13. Average time between relationships, in years, for category 1 political views.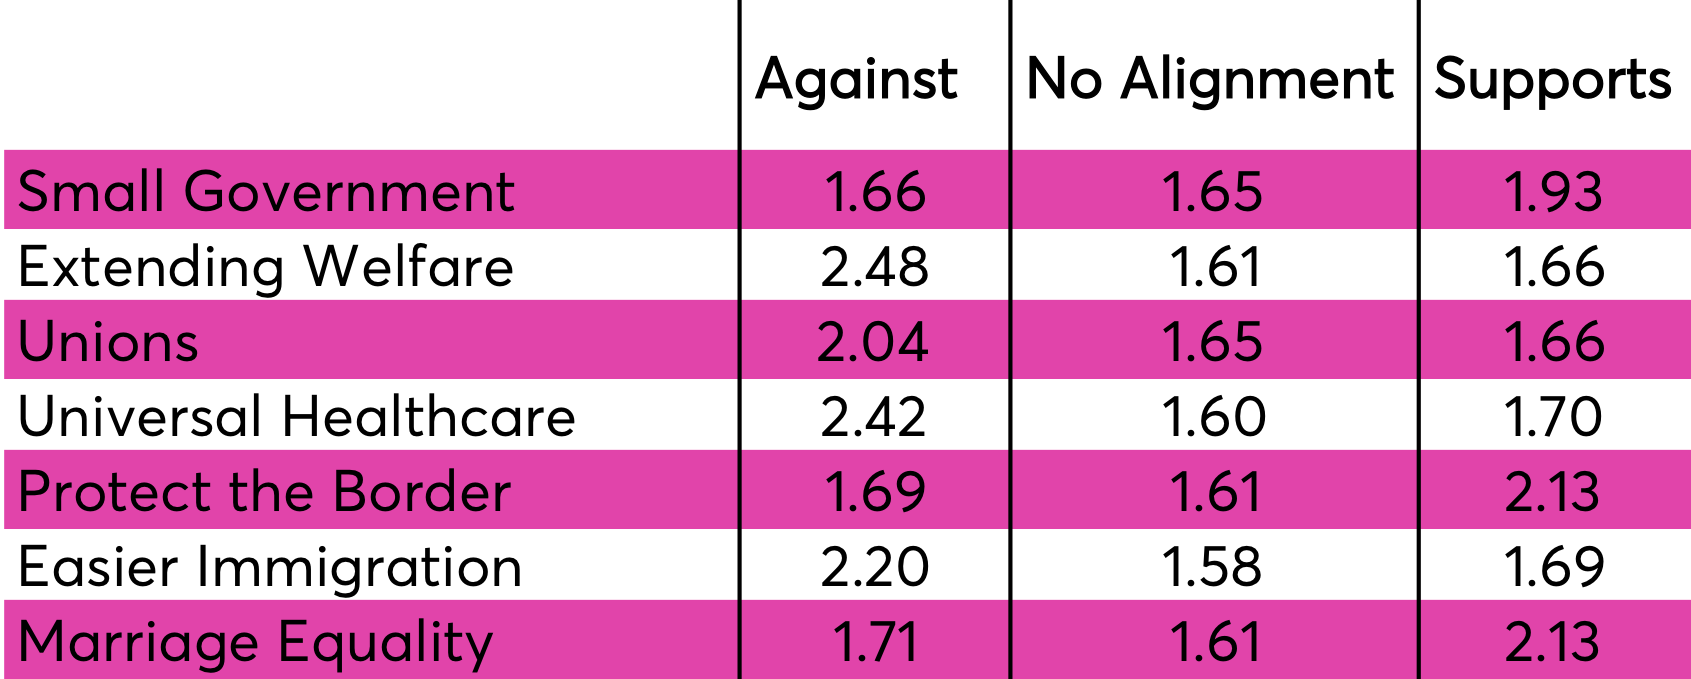
If you swap the direction of alignments and plot them, you can see that they all look like little hockey sticks. You’ll notice that unions and small government are flat while the others bend up.
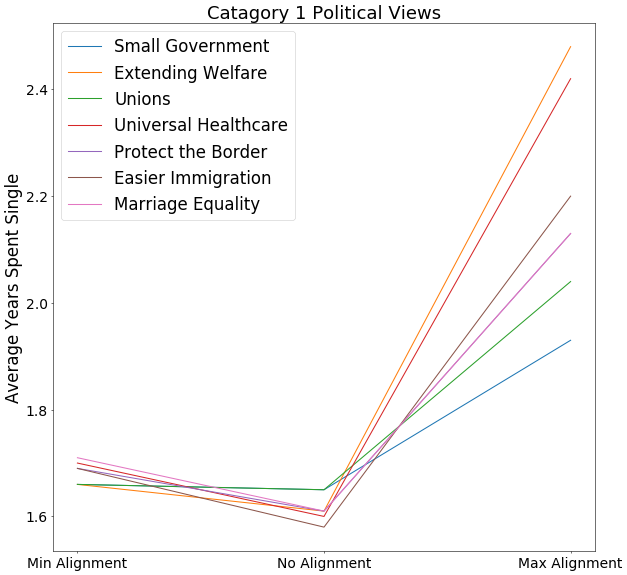
So the political views that have a significant impact that are correlated to spending more time single are:
- Opposition to marriage equality
- Opposition to easier immigration
- Opposition to universal healthcare
- Opposition to unions
- Opposition to extending welfare
- Supporting increasing border protection
- Supporting small government
So the question is: is there a pattern to the alignments and views listed above beyond the correlation with time spent single?
At this point, interpretation of how these views might relate is subjective and I invite others to offer their own interpretations with the data presented. Because the data is truly international, understanding the similarity between the views that result in spending more time single requires abstraction. Some of these views are in opposition to a perceived right to state-assured personal welfare (welfare, small government, healthcare), right to free association (marriage equality, unions), and right of free movement (immigration, border). To generalize further, the views that categorically result in spending more time single reflect, to first order*, the disenfranchisement of individual rights and freedoms. (*Here, first order being direct effect as opposed to secondary or higher order effect.) At its core, these views may be perceived as unsympathetic to the rights of others and this is a topic that I’ll cover in the next post.
This isn’t to say that people who hold these views hold them because they wish to disenfranchise the rights of others or that they are actually unsympathetic people. That’s why I qualify to first order, as second order effects may be disputed. For instance, I’m certain some would argue that larger government can go unchecked, ultimately resulting in diminished rights and freedoms. The same goes with the qualification of perceived as unsympathetic. Again, this is my own interpretation of the data, which is consistent with the analysis that follows in this post and the next. I invite others to offer their own interpretation and analysis!
Category 2: Outcomes where people without strong political views spend significantly shorter periods single than those with any strong political view (U-shape)
Table 14. Average time between relationships, in years, for category 2 political views.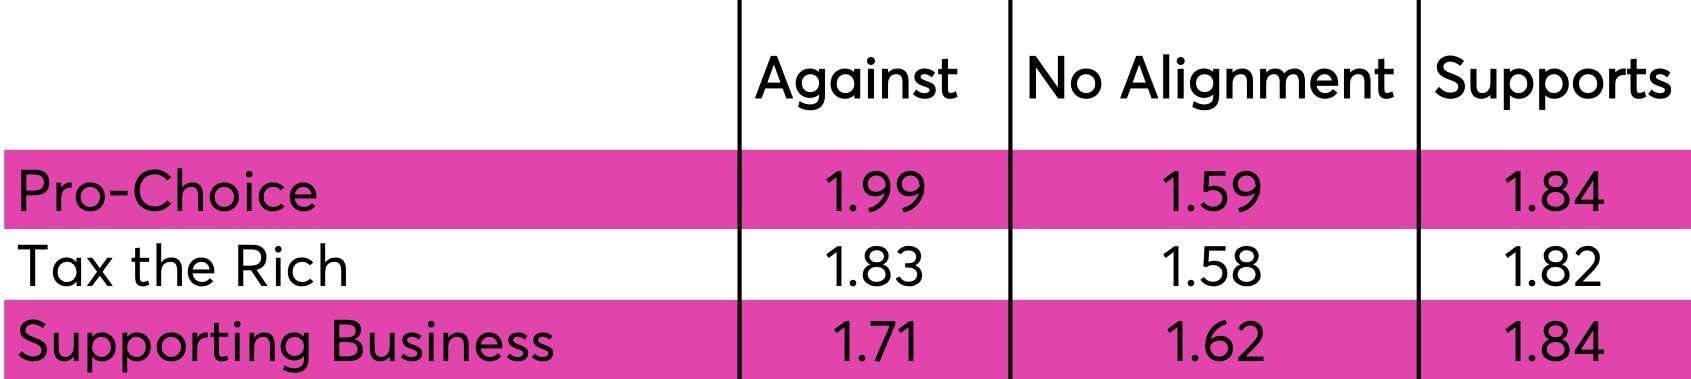
Despite the effect described in category 1, we still see the feature of the most fundamental result of this study that having any strong political view corresponds to spending more time single. For instance, people who support easier immigration will be single a little over a month longer than people without strong views on the topic, on average. It is the most “U-shaped” political view of the last category. The views in this category result in a more distinct “U-shape” (or V-shape).
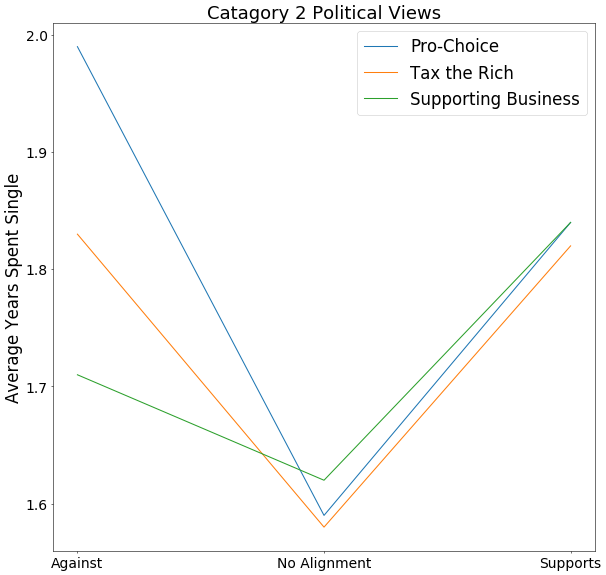
Again, this data clearly demonstrates that strong political views result in spending more time single, but what else unites the political views in category 2? People who are pro-choice value the rights of the mother over the unborn while those who are not pro-choice believe that the rights of the unborn are greater than that of the mother. While there are people who want to tax the rich in order to more effectively distribute capital in a society, people who don’t believe in taxing the rich may be or want to be rich and may also believe that an upper-class will help spur economic growth enriching everyone even more. The same argument can apply to people who do and don’t support business.
In this category, people with any strong political views can be construed as wanting to directly limit the personal freedoms of many people. (A note in my phrasing: my use of the term “unborn” is intentional as it reflects personhood with an equivalent right to life. Regardless of your feelings about the word, this is the perception of many in society based on billboards I see while driving on rural highways.)
This interpretation would provide more confirmation to a hypothesis that people who do not value and are not sympathetic the rights of others spend more time single.
Category 3: Outcomes where people with a strong political view have significantly shorter rebound times than the opposite political view or No Alignment (inverted hockey stick)
Table 15. Average time between relationships, in years, for category 3 political views.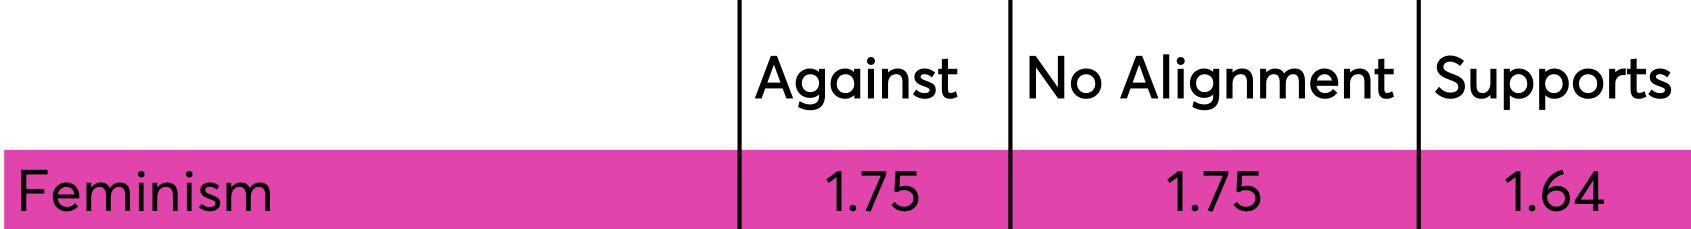
Well this is a pretty lonely category!
Feminism is a pretty tricky word to define and people have very different feelings about the word. Let’s start by resolving this issue by negation. People who are against feminism are against the franchisement of women. However, this may be because they view personal rights as zero sum. For each right a woman has, men or the family have a right removed. Whether or not this is the case, this is certainly the perception of some.
Based on our hypothesis, understanding why support of feminism is related to shorter rebound time becomes a question of how many people view women’s rights as a zero sum game. In the case of Nanaya users, more people support feminism and would interpret its support as enhancing personal freedoms rather than diminishing. The conclusion is consistent with hypothesis.
So a new question emerges: do people with unsympathetic political views spend more time single because of their political views themselves or is there a deeper, underlying reason for why this is the case?
Fortunately, this is something we can answer by evaluating the impact of psychology on how long people stay single…
Stay Tuned
Visit the blog next week when we’ll cover how our psychology affects how long we stay single!
Until then, predict your own love life with Nanaya, now on iOS and Android!