Nor are men. Or if women are crazy, then everyone’s crazy.
How do we know?
Over the past two months we’ve been building the database for the Nanaya algorithm – the first app that can scientifically forecast your love life and help you make romantic and social decisions. A major part of the algorithm requires searching through a database of personality traits.
Well measuring “crazy” is easier said than done. “Crazy” could mean a lot of things but I’m pretty sure people aren’t playing armchair psychologist when they accuse someone of it. Instead, let’s consider common relationship complaints of what “crazy” implies from what we’ve analyzed in our database.
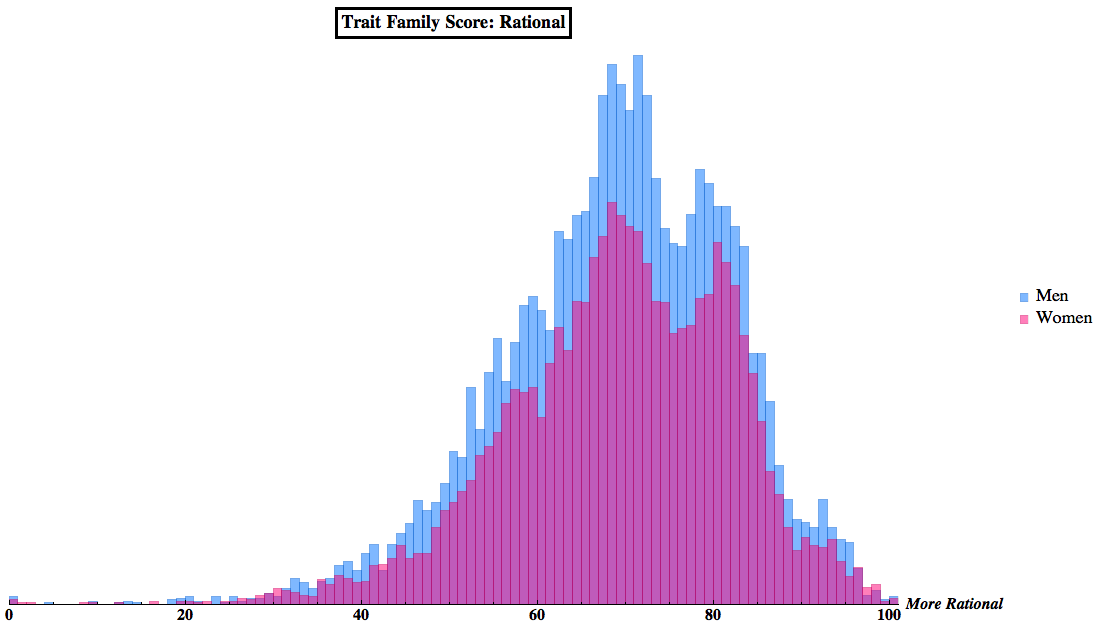
- Rational – this personality type encompasses a lot of other traits regarding how self-consistent and procedural someone is. More irrational, the more they may appear as “crazy.”
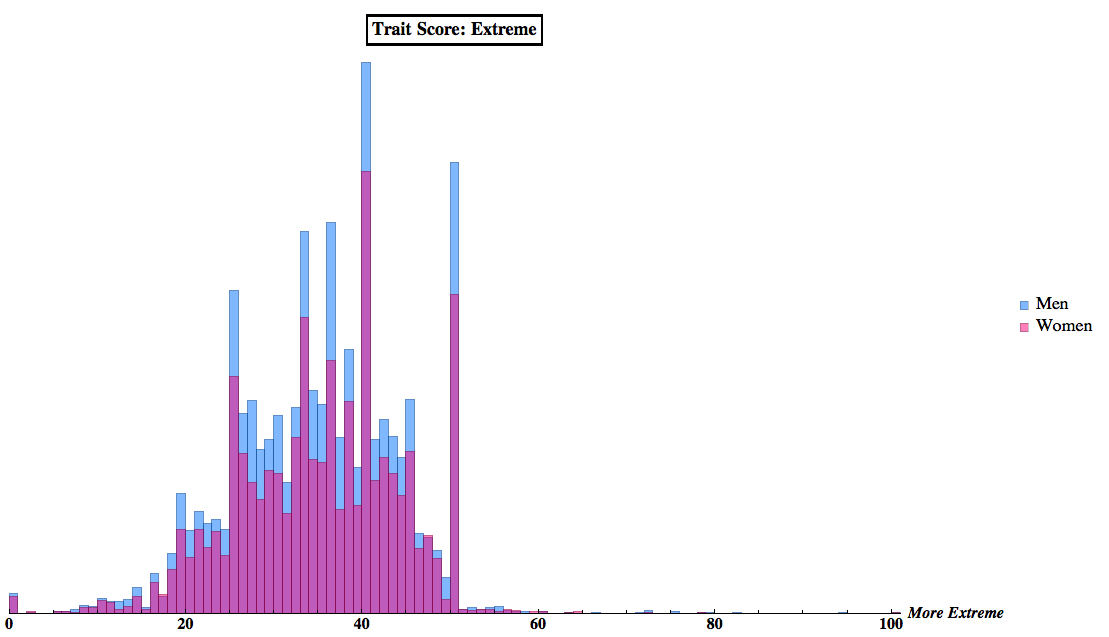
- Extreme – a trait contrasting with moderation. A person who is more extreme will lend itself to excess in their behavior. A partner may view someone who is extreme in their beliefs or behavior to be “crazy.”
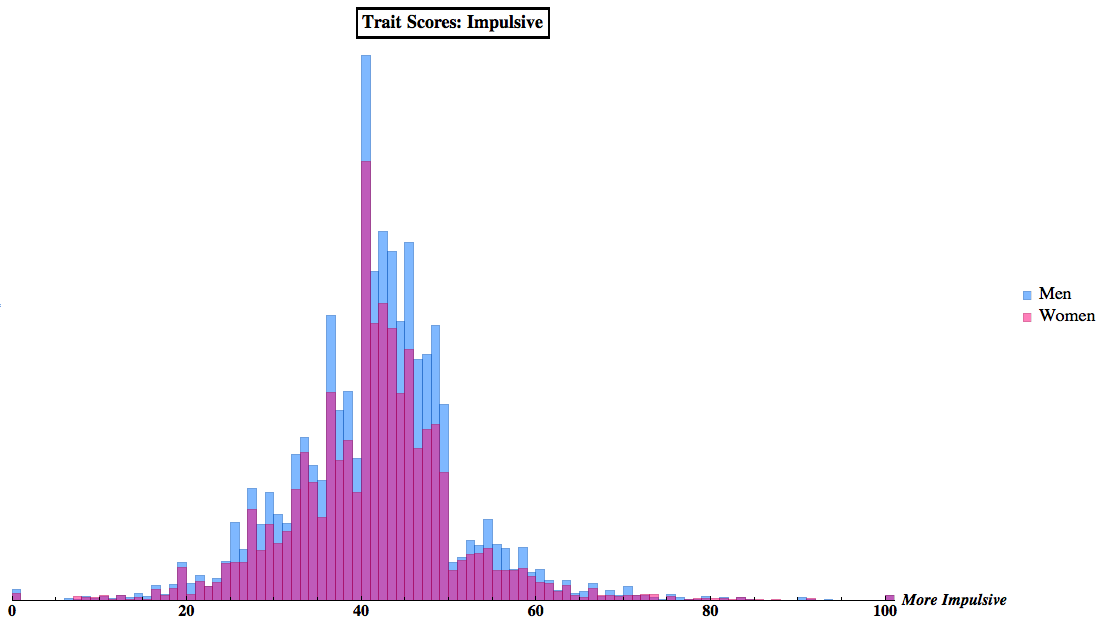
- Impulsive – a trait contrasting with inhibited. A person who is more impulse will exercise less self-control. A partner might see “crazy” manifested as impulsiveness.
Do note there are more men than women in the database. Also, it’s worth mentioning that gender isn’t fed into the personality test even though we ask for it.
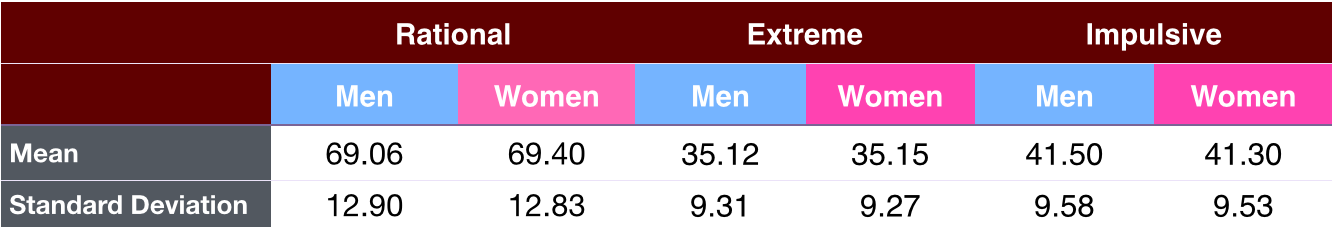
Seems that men and women are essentially identical when it comes to these traits. These distributions are very similar. We can break out the actual descriptive stats with the table below.
It bears mentioning that this data is international and about 20% of the data reflects America. If you’re interested in what a regional breakdown looks like, check out our last post on which nation is the best lover.
So there’s really no difference in gender when it comes to these traits. Surprised?
Obligatory Discussion
I have no idea where the notion that “women are crazy” first entered my mind when I was a boy. Playground talk involved cuties more than calling anyone crazy. I don’t remember my father expressing that when I was a boy. I can chalk it up to media or Hollywood, but even childhood memories of “I Love Lucy” seem relatively on par with mainstream dialogue on sexism. After a bit of thought, I still have no idea.
The bottom line is that the where and when I first heard “women are crazy” is as irrelevant as it is inevitable. “Women are crazy” is a popular, but non-scientific idea and it goes back a bit in history.
Of course, similar things can be said of men who are crazy in their own ways, chalked up as being emotionally insensitive and hormonally driven to commit acts of violence. There’s something troubling in the timeless pattern of young men always being the ones happy to march to war.
I wouldn’t blame “crazy” for failed relationships but I do blame people for using the label as an excuse to not be better listeners.
The distributions seen above are exactly that: distributions. For the psychology nerds out there, you can note the wider standard deviation on Rational as it is a synthetic score. That wider standard deviation implies that people really are different.
There’s nothing more “average” than not actually being average. Just as everyone is unique in their own way, what they’ll be compatible with will be just as unique. Of course that uniqueness comes with not just personality, but social context, history, and desires as well.
More reason to build Nanaya – to actually have a romance app that looks at the big picture and the small details to help you make decisions. Please help out and take the personality test. The more people take the personality test, the sooner Nanaya will be available.
Odds and Ends
If you want to complain about methodologies, gender-normative color selection, or anything else, send invectives and curses to info@nanaya.co, we’ll still love you. Through the power of the internet, that very same email also works for positive feedback and questions.
Data was pulled from the Nanaya dataset as of early March at around 17,000 users.
Histograms & analysis done in Mathematica.