Para la versión en español por favor haga clic aquí.
Let’s get straight to the chase.
Most Romantic Nations
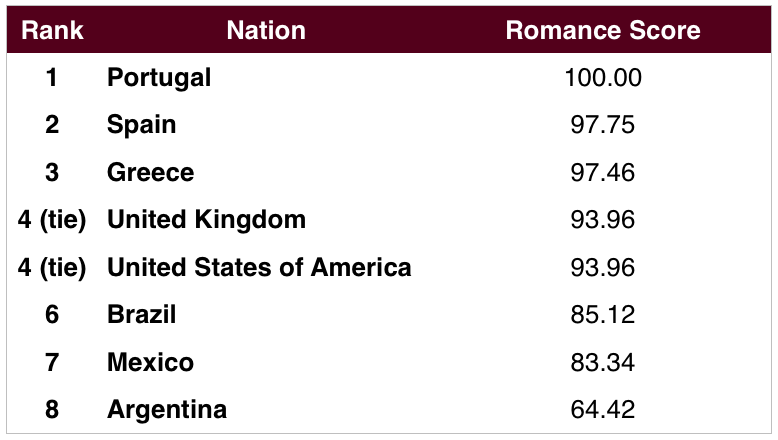
Higher score, better lovers?
Ok, well it’s awfully hard to date a whole country but we can describe the populations of a country. So how can we say which country is “the best lover” or simply “most romantic?”
We took our database of global personalities, picked out the countries with the most data, and weighted traits that impact romance to come up with different romance scores.
We came up with three types of romantic scores and found out:
- Mediterranean countries have the most romantic populations and Latin-American countries have the least. English speaking nations are in the middle.
- Love might be a universal language, but national language is less important than geographic proximity and shared culture.
- The more romantic a country is, the more divorces there are for each marriage.
- The more romantic a country is the higher unemployment is – but Nanaya needs more data to confirm this relationship.
How Did We Do This?
Nanaya will be a service that can forecast your love and social life – but running the Nanaya algorithm needs a big database of personalities. Since mid-January, Nanaya has hosted personality tests to build that database. Unlike many personality tests online, this test was built on a foundation of psychology producing scientific, repeatable results.
In the past few weeks, we’ve had well over 15,000 users around the world take the main personality test. If you haven’t taken it, do so here.
We can take those numerical personality test results to determine what makes a good lover, whether it’s for a hot fling or a long-term, stable relationship:
- Hot Fling Score. Hot flings are all about adventure and exploration, of the world and each other. A part of this is being social and charismatic. Without these traits, no one makes the first move. Thoughtfulness is important, that way you can read each other’s emotions and respond accordingly, but it trails the others in value.
- Stable Relationship Score. Stable relationships are a different matter. Things like reliability and thoughtfulness begin to matter more to make a relationship last. To be clear, this is more of a descriptive term than something that’s been correlated.
- Net Romance Score. The right relationship is a mix of a hot fling and stable relationship. I add and normalized the scores to come up with the ranking at the top.
No doubt what makes for a hot fling and a stable relationship are related – but they’re not entirely the same. I designed “hot fling” and “stable relationship” scores by weighting various personality traits differently. We then calculated these scores for the distributions of personalities in the countries we had the most data on. There’s a lot more countries in our database than those in this study, but there’s not enough for “significant” results.
Best Nations for Romance
Below is a bubble chart that shows the Hot Fling and Stable Relationship Scores for these countries.
Romance Scores Grouped by Language Spoken
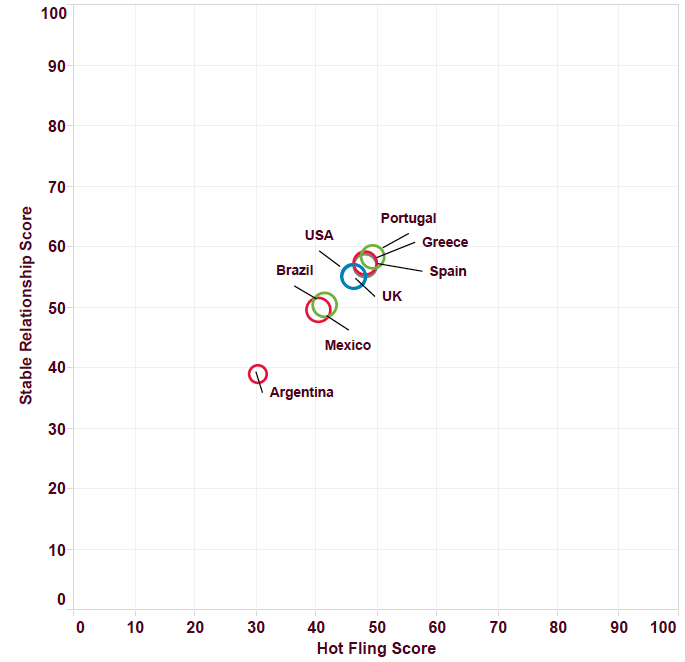
We expect these scores to be somewhat related. The fact they’re on a line means they’re highly correlated which makes perfect sense based on how we designed the scores. That said, they’re not totally the same. The differences emerge if we rank them separately.
Ranking of Hot Fling & Stable Relationship Scores
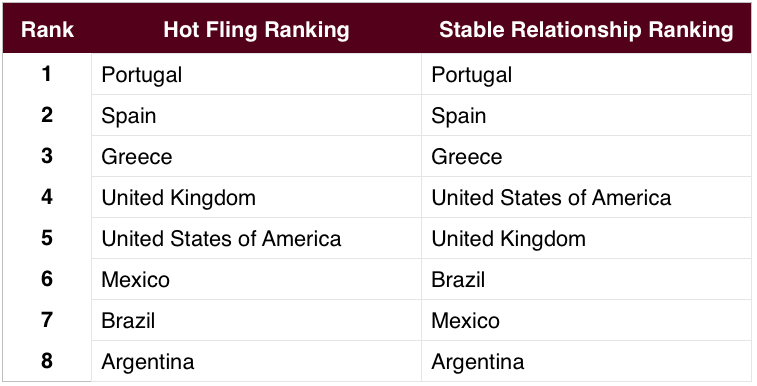
We’re sorry to report this, Argentina. If it helps, this is only a number and love is not a number.
However, our first guess that language was a uniting cultural feature was wrong. Let’s try a different way of grouping. Note, scores don’t change!
Romance Scores by Cultural Grouping
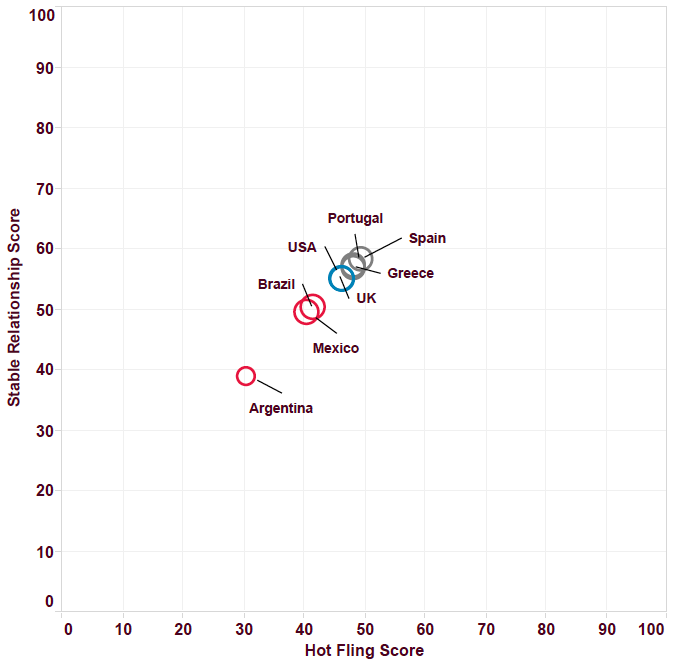
This grouping methodologies gives us much a more sensible, tighter distribution.
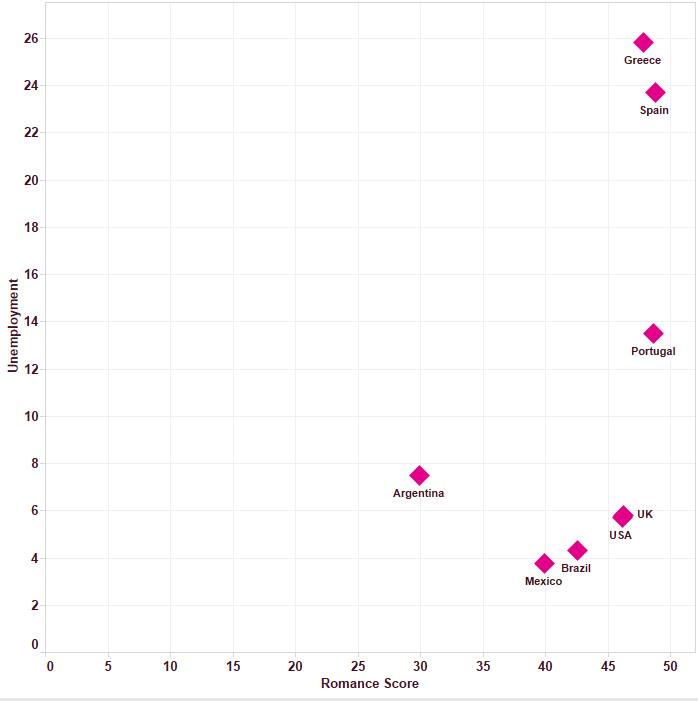
Now is there something unique about Mediterranean countries that leads to better lovers? Greece is not a Catholic country whereas Spain and Portugal predominantly are. One uniting feature is that all have relatively high unemployment.
Well there’s a thought, do unemployment and romantic score have a relation? We’ll just pick Hot Fling Score as there is a fundamental correlation between with Stable Relationship & Net Romance Scores.
Hot Fling Score and Unemployment
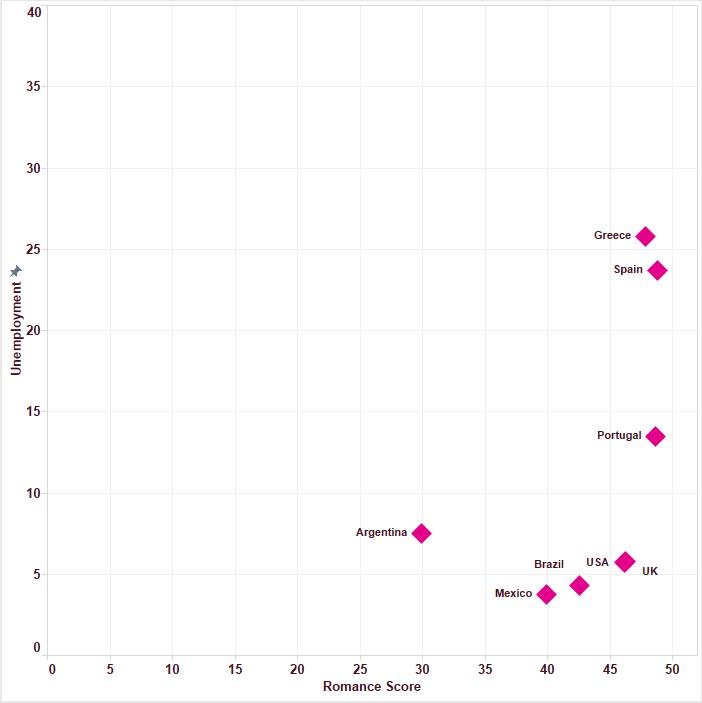
Yikes! So the more amorous and passionate a nation, the less likely they’ll be at work or to have the stable institutions in place? There’s a lot of history, recent events, and other metrics that require delving into to prove this. I’m skeptical but it is interesting.
Well if there is a correlation, it’s not a linear one! Maybe we’ll revisit this when we have more data. For the curious, we got our unemployment data based on January 2015 values from here.
What about Gender?
So for a given country and trait, what do these differences look like across men and women?
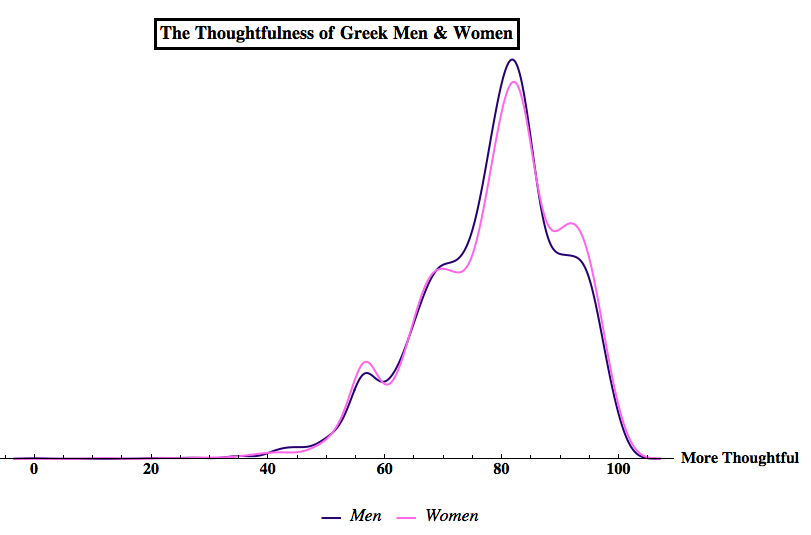
Typically, men and women will have very similar distributions for a given trait in a specific country. We consider the “thoughtfulness” of Greeks below.
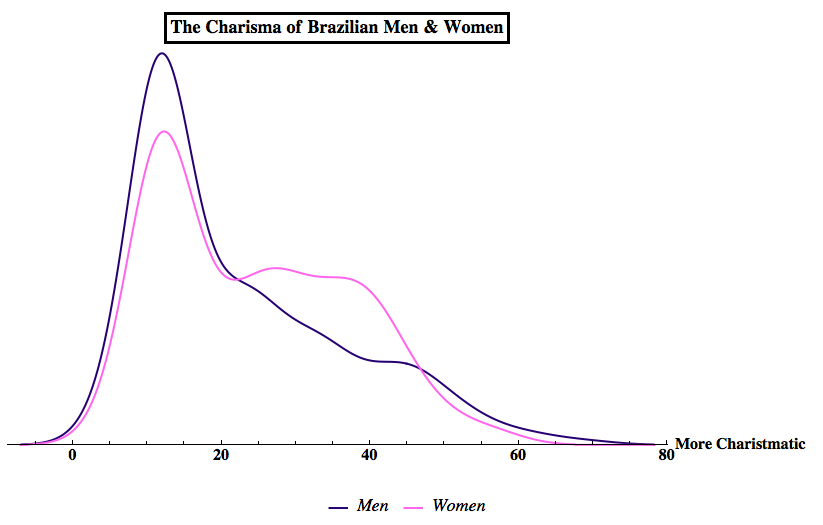
But this can be contrasted by a few cases which skew results across men and women, such as in the two different romance scores. Here, we look at the charisma of Brazilians.
This is just a brief overview of the difference gender makes. Stay tuned to the Nanaya Blog for future posts discussing the impact and role of gender in psychology and sociology!
Romantic Score and Romantic Success
Now all of this is for entertainment if we don’t see an actual correlation between romantic score and reality. But what’s a good reality check?
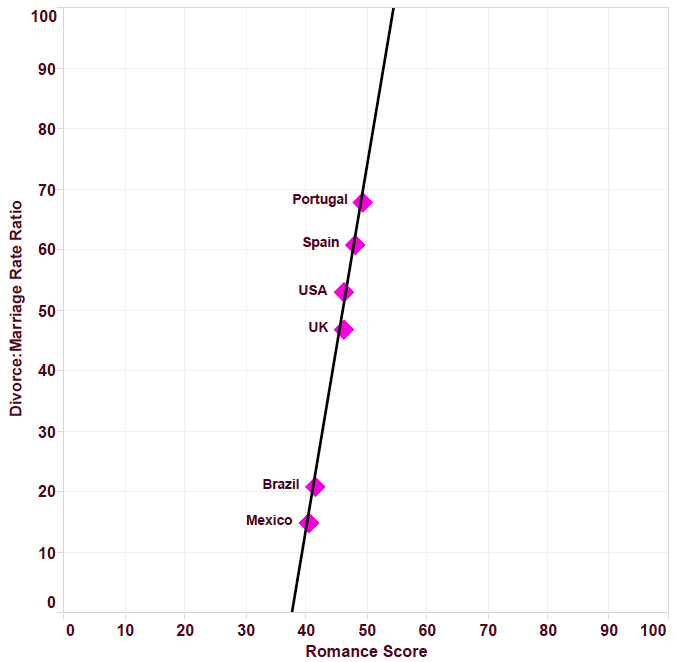
We need a publicly available indicator that tells us that people are getting into long-term relationships while tracking how fast people are leaving them. My guess is that more romantic countries are, the more they’ll be able to sustain relationships with fewer divorces for every marriage. Conveniently, there’s a name for that indicator: ratio of divorce rate to marriage rate (data from here). Unfortunately, there’s no publicly available divorce rate from Argentina, but otherwise we have the below.
Hot Fling Score Vs Divorce-to-Marriage Rate Ratio
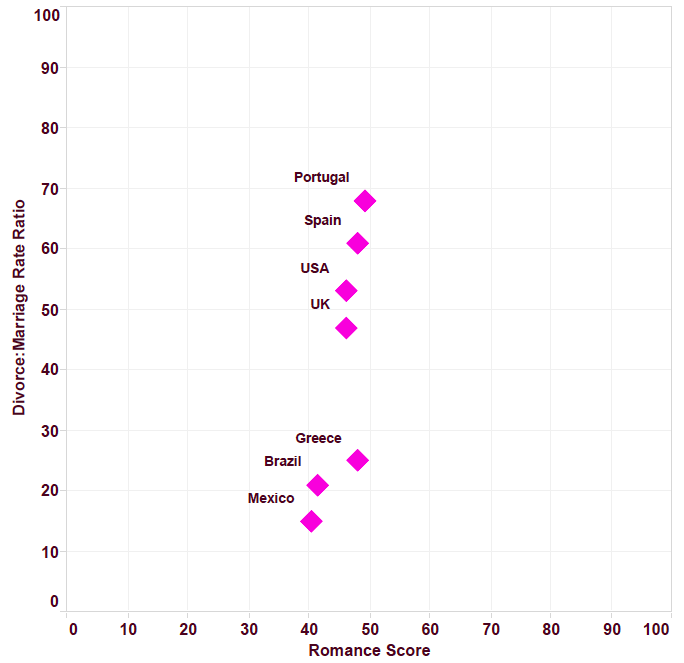
Hmm…Greece here is an outlier. Why? There could be a lot of reasons, maybe to be covered in another blog post down the line. That said, looking at our P-test value we do see some linear correlation. If we had a good reason to take Greece out of the picture, like some unique cultural feature invisible in this level of data (e.g. Orthodox Christianity), we would have the following:
Hot Fling Score Vs Divorce-to-Marriage Rates Ratio (no Greece)
So it turns out my guess was wrong – completely wrong but in the best way possible. More national data would be great, but we simply had no idea that there’d be this strong of a linear correlation.
Even with Greece, while romance score is a predictor for long-term success, the more romantic the nation the more divorces there will be. More romance and more emotional exchanges may allow for more room for cracks in the relationship to grow and romantic opportunities beyond the relationship to open up. This even applies in Catholic countries!
We only have a few countries of statistically significant size, but hopefully we can redo this study later to see how this indicator may change. Even with Greece, our P-Test value still indicates correlation.
Odds & Ends
There’s a sample bias going on across all countries that’s pretty uniform: they were interested enough to take a personality test on Nanaya. This crowd is a bit younger and more urban than the whole national population. Maybe a later post will discuss how we can statistically control Nanaya studies.
Don’t like what you see? Want to see your country included? Take the personality test and make data big. The more people take the personality test, the sooner Nanaya will be available.
If you want to complain, send invectives and curses to info@nanaya.co, we’ll still love you. Through the power of the internet, that very same email also works for positive feedback and questions.
Hot Fling, Stable Relationship, and Net Romantic Scores are synthetic metrics and aren’t a part of a Nanaya algorithm.
Data was pulled from the Nanaya dataset as of January 31, 2015 at around 15,200 users. It’s grown quite a bit since.
Bubble charts generously plotted by Jackie Wisniewski. Histograms & analysis were done in Mathematica.