Valentine’s Day is just around the corner and it’s a big day for us here at Nanaya. Last weekend, I downloaded a dataset with all these international personalities and started investigating to see what insights existed. This week, we’ll be publishing our first investigation: “Which Nation Is the Best Lover?”
To recap, a little less than a month ago we opened up Nanaya to personality testing and were shocked with the response. In about three weeks, well over 15,000 people from countries all around the world came in to take the personality test and register for access to Nanaya, the only app that can scientifically forecast your love life.
On behalf of Nanaya, I just want to thank the world for your support, especially America, Greece, Spain, Mexico, Portugal, Argentina, Brazil, and the UK. This is the sort of response that makes me confident that we’re building an app that people want. The more people take the personality test from your region, the sooner Nanaya will be available. Take the personality test here.
For each gender and nation, we’ll analyze the aspects of personality in those population that would result in successful flings and steady, long-term romances. This really simple investigation led to some shocking findings:
- What makes nations culturally similar? Is language or geography more important?
- Is gender or culture more psychologically significant? Can we shed insight into the problem of “nature vs nurture”?
- Is there a relationship between how “romantic” a country is and marriage and divorce?
So far the results are very surprising!
Stay tuned! Until then, let’s see how adventurous British women and men are.
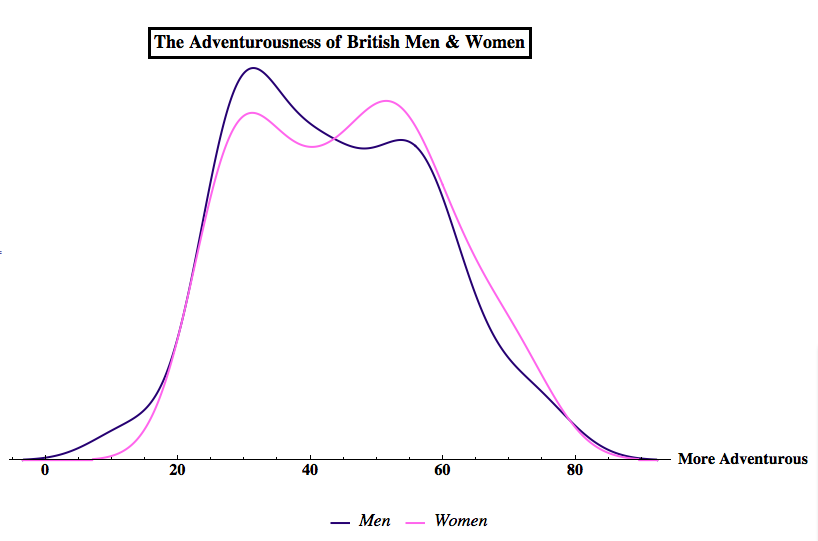
The chart is a histogram, telling us how many men and women scored “adventurous” on the Nanaya Core personality test. Higher the line, the more frequently men or women scored that value. Here specifically, we can see women and men are mirror images of each other in the UK! Women are more likely to be adventurous than their male counterparts.
Maybe history would have been very different if there were more Mary Kingsleys and less Francis Drakes and James Cooks?